IQ Metrics
IIF Certified Assessment Start IQ Test
IIF Certified Assessment

Growth Mindset and Intelligence

Research & Evidence

Growth Mindset and Intelligence: What the Trials Found

The claim that believing intelligence is malleable makes you achieve more is one of the most widely taught ideas in education, and one of the most heavily contested in the research literature. Three waves of evidence have now landed. Here is what each found, and the question none of them actually answered.

Chart comparing three waves of growth mindset evidence, showing a weak pooled intervention effect, a targeted national trial that worked for lower-achieving students, and a later review finding widespread bias

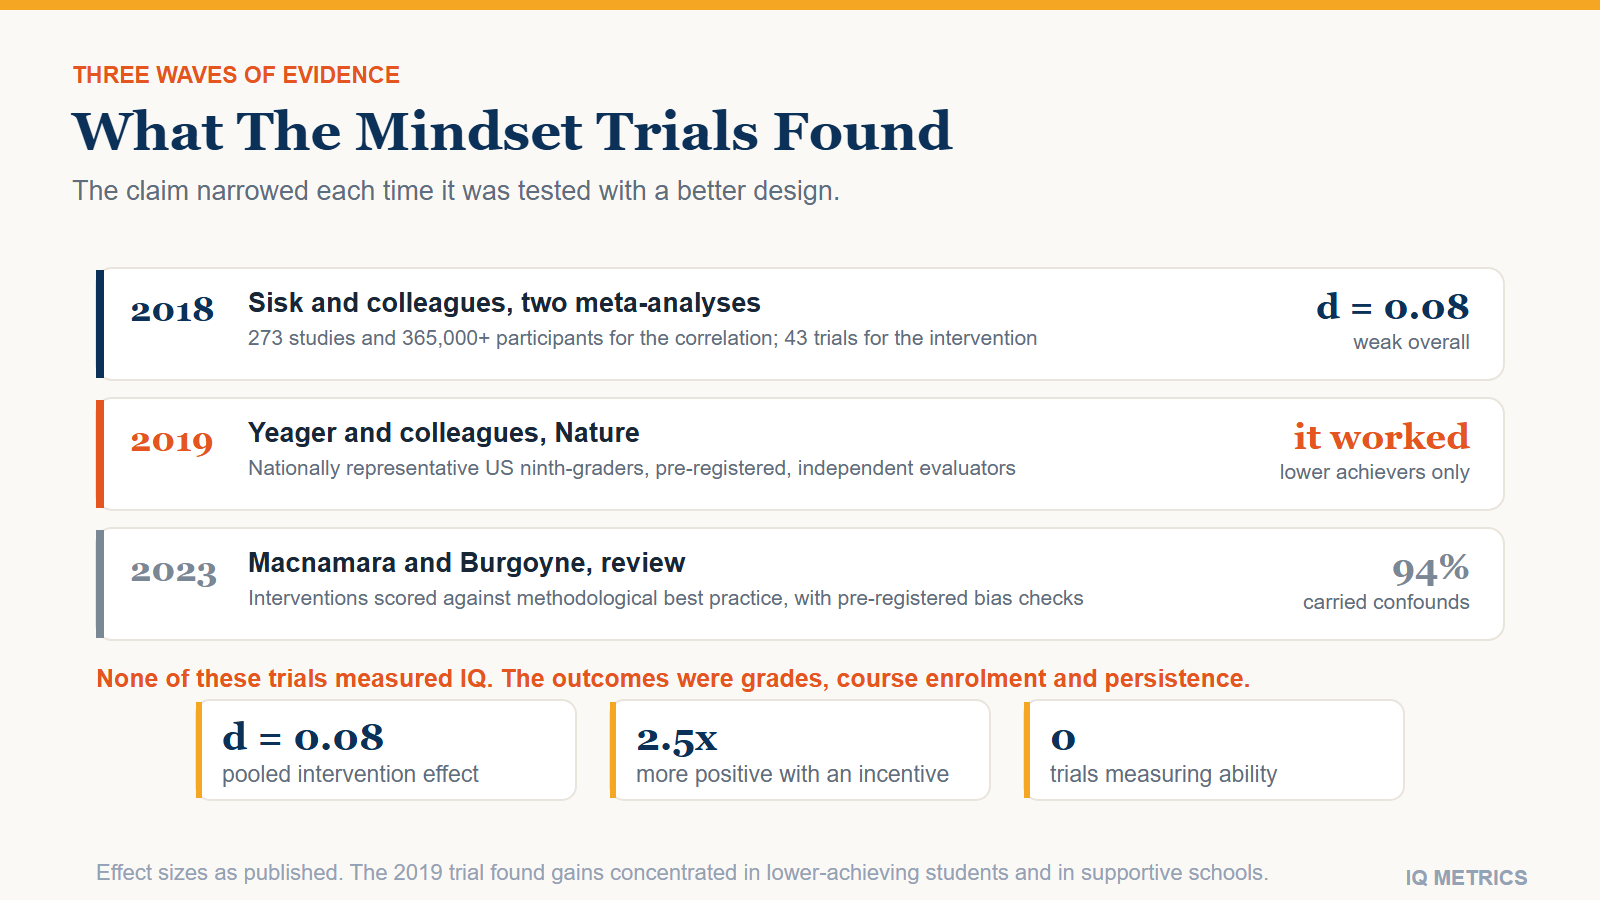
The growth mindset claim is that believing intelligence can be developed leads people to work differently and therefore achieve more. It has been taught in schools worldwide for two decades. The evidence, taken as a whole, supports a much narrower version than the one that got taught: pooled across trials the effect on achievement is small, in one large national experiment it was real but concentrated in specific students and specific schools, and a 2023 review found the literature itself carries serious bias.

There is also a question that gets quietly skipped in almost every popular account, and it matters more here than anywhere else on this site: no growth mindset trial has measured IQ. Not one. What follows separates what was tested from what is claimed.

What the claim actually is

Carol Dweck’s framing distinguishes a fixed mindset, in which ability is a trait you have a fixed amount of, from a growth mindset, in which ability develops through effort and strategy. The predicted mechanism is about response to difficulty: someone who reads a failure as evidence of a limit withdraws, while someone who reads it as evidence that the approach needs changing persists. The intervention is usually short — often under an hour online — and teaches the brain-as-malleable idea directly.

It is worth being precise about the claim, because the popular version drifts. The research claim is that mindset affects behaviour under difficulty and therefore achievement. It is not that believing you can get smarter makes you smarter, which is a much stronger claim that nobody set out to test.

The first meta-analysis found a weak effect

In 2018 Victoria Sisk and colleagues ran two meta-analyses. The first pooled 273 studies with over 365,000 participants to ask how strongly mindset correlates with academic achievement. The second pooled 43 intervention studies with over 57,000 participants to ask whether teaching a growth mindset changes achievement. Both effects were weak. The intervention effect came out at d = 0.08 — statistically distinguishable from zero given the sample size, and small enough that it would be invisible in any individual classroom.

The moderator analysis was more interesting than the headline. Effects were larger for students who were academically at risk and for students from low socioeconomic backgrounds. That is a coherent pattern rather than noise: an intervention that addresses a belief can only help someone whose belief was the obstacle, and a student already doing well was probably not held back by thinking ability was fixed. It also predicts that universal rollouts will underperform targeted ones, which is roughly what happened.

Chart comparing three waves of growth mindset evidence, showing a weak pooled intervention effect, a targeted national trial that worked for lower-achieving students, and a later review finding widespread bias

The national experiment, and where it worked

The strongest single piece of evidence is the National Study of Learning Mindsets, published in Nature in 2019 by David Yeager and a large team. It is the study to take seriously: a nationally representative sample of United States ninth-graders, randomised, pre-registered, with the analysis plan set in advance and independent evaluators. The design was built to settle the question rather than to confirm it.

It found a real effect, and found it in a specific place. Grades improved among lower-achieving students, and enrolment in advanced mathematics rose. Among students already doing well, little changed. The effect also depended on the school: it held where peer norms supported taking on academic challenge and faded where they did not. A one-hour online exercise cannot sustain a behaviour that a student’s environment discourages, which is a finding about the limits of cheap interventions generally.

So the honest summary of the strongest study is not “growth mindset works” or “growth mindset failed”. It is that a well-designed version produced a modest, targeted improvement in grades for the students who needed it, in schools that reinforced it.

Your own number

Where would your own score land?

Take the IIF-certified assessment and get your score with the scale it was measured on, the percentile it corresponds to and the confidence range around it — the three figures most online tests leave out.

Find your IQ score now! →

Secure & encryptedInstant results10–20 minutes

The 2023 review found bias in the literature

Macnamara and Burgoyne then examined the intervention literature against a set of methodological best practices, and the results are the reason for caution about the wider field rather than about any one trial.

  • 94 percent of the growth mindset interventions reviewed carried confounds — the treatment group got something other than the mindset message that the control group did not.
  • Authors with a known financial interest in mindset training were about two and a half times as likely to report positive effects.
  • Higher-quality studies were less likely to show a benefit, which is the signature pattern of an effect that shrinks as methods improve.

That last point is the serious one. A real effect usually holds up or sharpens under better methods. An effect that fades as designs tighten is more consistent with bias in the weaker studies than with a robust phenomenon, and it is the same pattern that deflated the brain-training literature.

A quieter problem runs underneath all of it: measurement. Mindset is usually captured by a handful of self-report items asking whether you agree that intelligence is fixed. Whether agreeing with those statements corresponds to how a person actually behaves when a problem gets hard is not well established, and different studies operationalise the construct differently. When the definition, the measure and the intervention all vary between studies, a pooled effect size is harder to interpret than the single number suggests — a point subsequent commentaries have pressed on both sides of the dispute.

Does any of this change an IQ score?

There is no evidence that it does, and almost no evidence either way, because the outcome measures in this literature are grades, course enrolment and task persistence. Cognitive ability was not the dependent variable in the trials that matter, so anyone citing growth mindset as a route to a higher IQ is extrapolating well past the data.

A weaker version is defensible. Beliefs about ability plausibly affect how someone approaches a test — whether they persist on a hard item or give up on it — and effort on the day is a genuine source of variation in scores. That would be an effect on measured performance rather than on underlying ability, which is the same distinction that applies to stereotype threat and to test anxiety. Both belong to the set of factors that move a result without moving the ability behind it.

What survives the criticism

Stripped of the oversell, several things stand. Targeted interventions for struggling students have the best support and the clearest mechanism, and the students they help most overlap substantially with the ones whose circumstances constrain them in the first place — the pattern described in the evidence on socioeconomic status. Context matters: the same message lands differently depending on whether the environment supports acting on it. And a short, cheap intervention producing any measurable change in grades is not nothing, provided nobody sells it as a substitute for teaching.

What does not survive is the strong version: that mindset is a major determinant of achievement, that a one-hour exercise transforms outcomes for everyone, or that it touches cognitive ability. That version was always more popular than it was supported, and it is a useful case study in how a modest finding becomes a movement — the same trajectory as several of the persistent myths about the brain.

What to do with this

If you are a student or a parent, the defensible takeaway is modest and still worth having: treating difficulty as information about strategy rather than as a verdict on capacity is a better response, and it is most valuable for someone who has been struggling. Just do not expect it to substitute for the things with larger effects, most obviously time in education itself.

If the underlying question is how much of ability is fixed, the evidence sits across three articles rather than one: what heritability actually means, how far practice takes you, and what moves a score. And if you want a measurement rather than a belief about yourself, a properly normed test is the shortest route to one.

Share this article

Know someone who keeps seeing these numbers quoted without the scale they were measured on? Send it to them.

Tagged Academic Achievement, cognitive ability, Dweck, education, fixed mindset, growth mindset, growth mindset and intelligence, intelligence research, IQ Science, learning, meta-analysis, motivation, replication crisis, Stereotype Threat

Talent vs Practice

Research & Evidence

Talent vs Practice: What Decides How Good You Get?

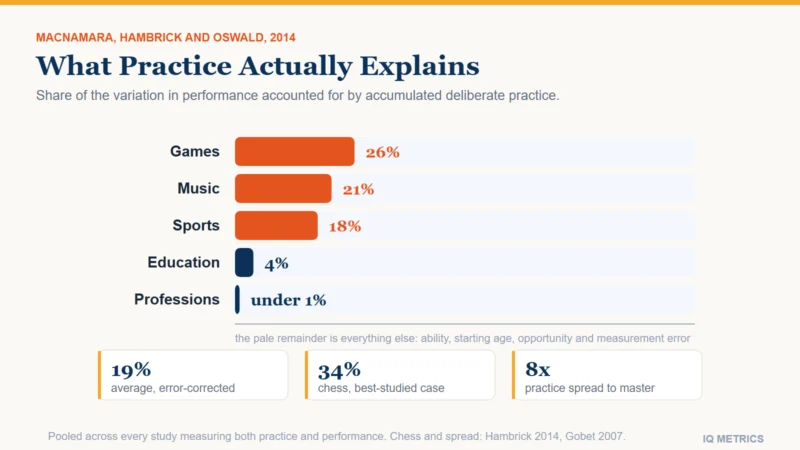
The 10,000-hour rule made a strong claim: expert performance is built by practice, not given by talent. When researchers pooled the studies that had actually measured it, practice explained about a quarter of the difference between people in games and almost none in professional work. Here is what fills the rest of the gap.
Bar chart of the percentage of performance variance explained by deliberate practice in five domains, from 26 percent in games down to under 1 percent in professions, with the unexplained remainder shown

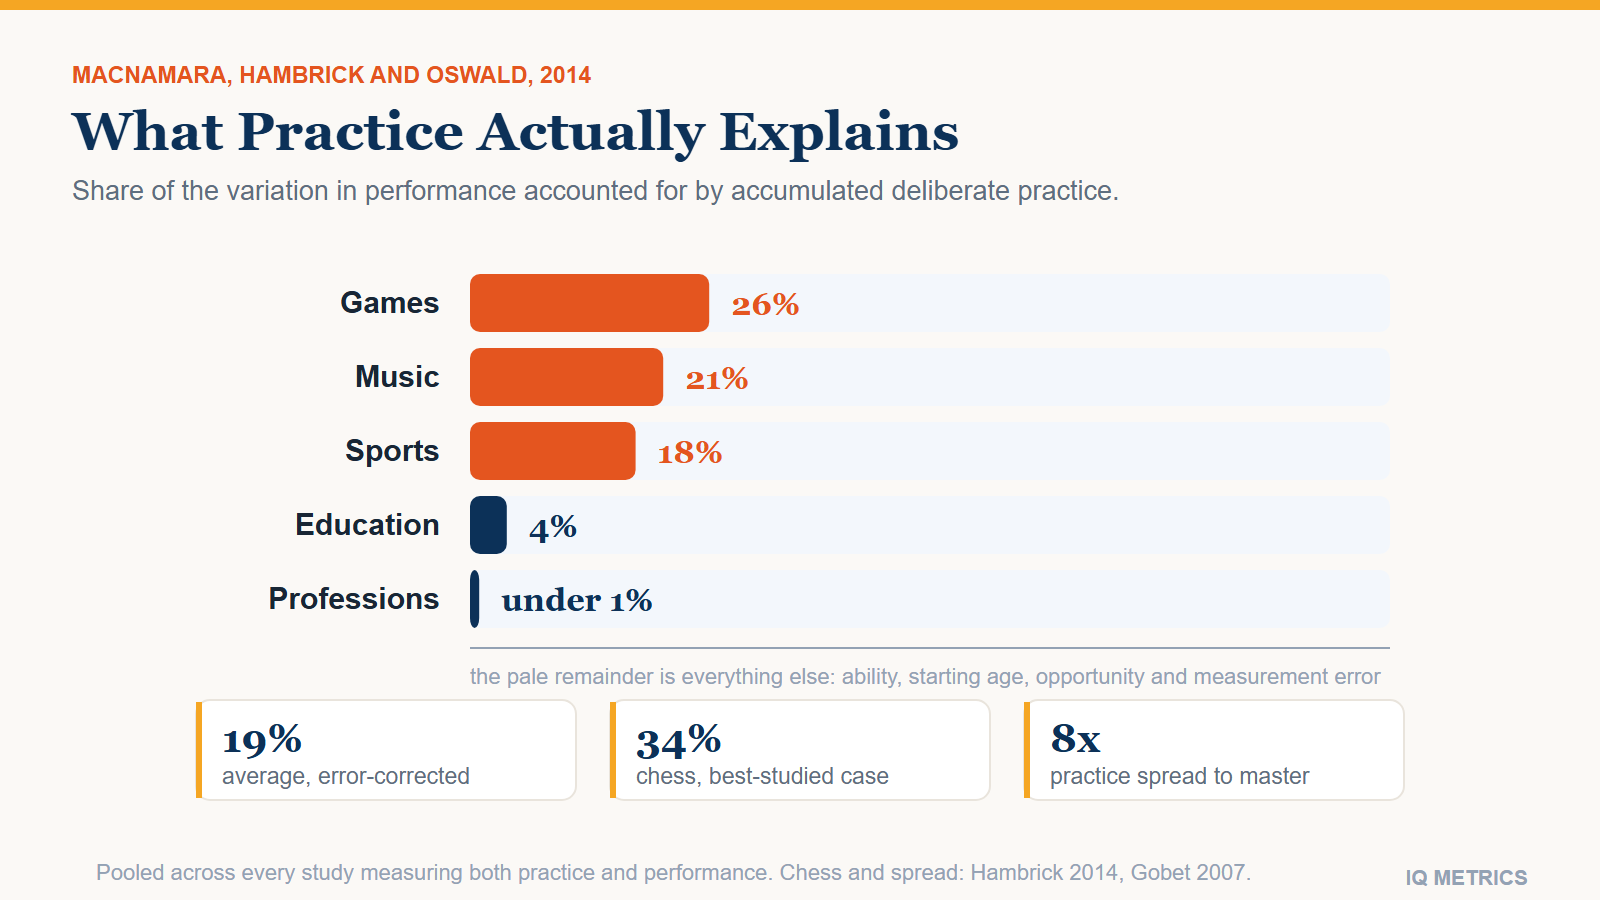
Practice matters enormously and it does not explain most of the difference between people. Those two statements are both supported, and holding them together is the whole of this subject. When Brooke Macnamara, David Hambrick and Frederick Oswald pooled every study that had measured accumulated practice against performance, practice accounted for 26 percent of the variance in games, 21 percent in music, 18 percent in sports, 4 percent in education and less than 1 percent in professional work. Averaged across domains and corrected for measurement error, about 19 percent.

That is a large effect by the standards of psychology and a small one relative to what was claimed. This article traces how the claim got made, what the numbers look like domain by domain, what occupies the remaining variance, and what any of it means for a test score.

Where the 10,000-hour rule came from

The research behind the slogan is a 1993 study by Anders Ericsson and colleagues of violinists at a Berlin music academy. The best students had accumulated substantially more solitary, effortful practice than the good ones. Ericsson called this deliberate practice and drew a sharp distinction between it and merely playing a lot: it is structured, aimed at a specific weakness, and immediately corrected.

Two things then happened. The finding was popularised as a threshold — ten thousand hours and you are an expert — which Ericsson himself disowned, since the figure was an average for one group in one conservatoire and not a target. And the stronger theoretical claim, that individual differences in expert performance are largely or wholly a product of deliberate practice, became the thing everyone remembered. That claim is testable, and it has now been tested a great deal.

What happened when the studies were pooled

The 2014 meta-analysis is the central result. Its design is simple: gather every study that recorded both accumulated deliberate practice and a performance measure, and see how strongly they relate. The domain-by-domain spread turned out to be far more informative than the average.

  • Games — 26 percent of variance explained, the strongest domain, and chess supplies most of the data.
  • Music — 21 percent, the domain the original claim was built on.
  • Sports — 18 percent.
  • Education — 4 percent.
  • Professions — under 1 percent, which is to say essentially nothing.

The gradient is the finding. Practice explains most where the task is stable, closed and well-defined, and almost nothing where the work is variable and the goalposts move. A chess position obeys the same rules it did a century ago; a job does not. So the ten-thousand-hours framing is least wrong exactly where people are least likely to apply it, and least applicable to the careers it is usually invoked about.

Bar chart of the percentage of performance variance explained by deliberate practice in five domains, from 26 percent in games down to under 1 percent in professions, with the unexplained remainder shown

Chess is the best-studied case

Chess is where the evidence is richest, because ratings give a continuous, well-calibrated performance measure that few domains can match. A 2014 reanalysis by Hambrick, Oswald, Altmann, Meinz, Gobet and Campitelli put deliberate practice at 34 percent of the reliable variance in chess skill and 29.9 percent in music. A third is a lot. It is also not most of it.

The more striking number comes from a 2007 study by Fernand Gobet and Guillermo Campitelli of 104 Argentinian players ranging from weak amateurs to grandmasters. The minimum practice needed to reach master level was around 3,000 hours — and the slowest player to get there had needed roughly eight times as much as the fastest. Both reached the same title. If practice hours were the mechanism, that spread should not exist.

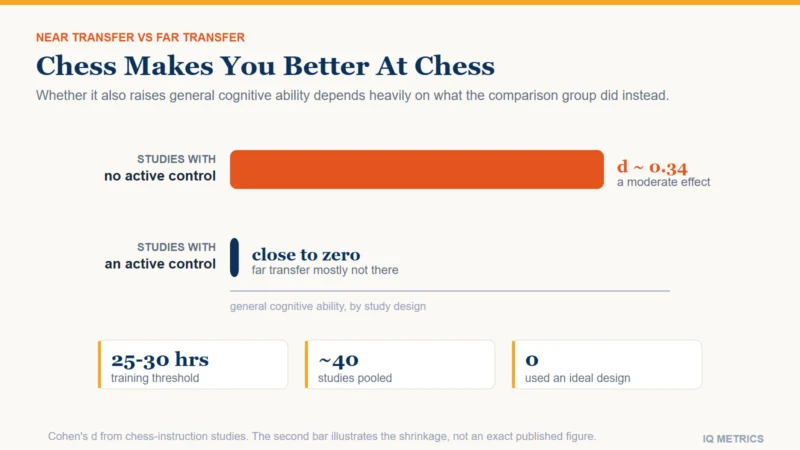
Note the boundary of this claim. It is about how much practice buys you at the top of one game, not about whether playing chess makes you generally smarter, which is a different question with a different answer — covered in the article on chess and IQ.

Your own number

Where would your own score land?

Take the IIF-certified assessment and get your score with the scale it was measured on, the percentile it corresponds to and the confidence range around it — the three figures most online tests leave out.

Find your IQ score now! →

Secure & encryptedInstant results10–20 minutes

So what is the rest of the variance?

Some of it is measurement. Retrospective estimates of practice hours are self-reported and often reconstructed years later, which attenuates any correlation and means the true effect is somewhat larger than the raw numbers suggest. The 2014 meta-analysis corrected for this, which is why its corrected figures run higher, and honest accounting has to concede it.

Beyond that, several factors have real support. Starting age matters independently of total hours. Working memory capacity predicts performance in some domains even among people matched on practice, and it is worth being precise that this is a capacity distinct from reasoning ability — the difference is set out in the piece on working memory and reasoning. And reasoning ability itself predicts the early rate of skill acquisition particularly strongly, which is why measures of fluid ability show up in expertise research at all.

There is also a selection effect that is easy to miss. People who improve quickly tend to enjoy the activity and keep going; people who improve slowly tend to stop. Accumulated practice is therefore partly an outcome of early aptitude rather than purely a cause of later skill, and no correlational design can fully separate the two.

One more caveat cuts the other way, and it is the reason these percentages should not be read as constants. Variance explained depends on who is in the sample. Study only grandmasters and almost everyone has practised enormously, so practice explains little of what separates them; widen the sample to include beginners and the same variable suddenly explains a great deal. Much of the expertise literature deliberately samples near the top, which pushes the practice figure down. The gradient across domains survives this objection, because it compares like with like, but any single number does not travel well outside the sample that produced it.

Ericsson objected, and the objection is partly fair

Ericsson’s response was that the meta-analysis diluted his construct: many of the pooled studies measured accumulated experience or general practice, not deliberate practice in his strict sense of individualised, coached, immediately corrected work on a specific weakness. That is a real methodological objection and it is probably right that the pooled figure understates properly-defined deliberate practice.

It also does not rescue the strong claim. Even within chess and music, where the measures come closest to his definition, the figure lands around a third. And the strict definition creates a problem of its own: if only practice that produces improvement counts as deliberate, the theory becomes difficult to falsify. The defensible position that survives both sides is that deliberate practice is necessary and not sufficient.

Why this is not an argument for giving up

The variance-explained framing answers a question about differences between people who are already competing. It does not tell an individual what returns their own effort will produce, and those are two different questions. Nobody reaches master level at anything on 300 hours. The floor is real even where the ceiling is unevenly distributed, and almost everyone reading this is nowhere near their own floor.

What the evidence does argue against is the inference that someone who improved slowly did not try hard enough. That is the moral sting of the strong practice claim, and it is not supported. It also argues against the reverse error — reading a test score as a verdict on your ceiling. A score is a measurement of current ability under specific conditions, which is why what a score predicts about later outcomes is always a matter of averages and never of individuals.

What it means for your own score

Treat ability and practice as inputs that multiply rather than as rivals. Higher reasoning ability buys a faster rate of return on the same hours, which is why it shows up in early acquisition; sustained practice compounds whatever rate you have, which is why it dominates at the top of narrow, stable domains. Neither substitutes for the other, and a score tells you about one input on one day.

If the underlying question is whether the ability itself can be moved, that is covered in what actually raises a score, and the specific claim that believing ability is malleable changes outcomes is examined in the growth mindset evidence. To get a current measurement rather than an estimate, take a properly normed test.

Share this article

Know someone who keeps seeing these numbers quoted without the scale they were measured on? Send it to them.

Tagged 10000 hour rule, chess, cognitive ability, deliberate practice, Ericsson, expertise, intelligence research, IQ Science, learning, nature versus nurture, skill acquisition, talent, talent vs practice, Working Memory

Socioeconomic Status and IQ

Research & Evidence

Socioeconomic Status and IQ: What the Evidence Shows

Family circumstances track IQ scores, and the relationship is stranger than a simple gap. In the poorest families studied, genes explained almost none of the variation in childhood scores and shared environment explained most of it. In affluent families the pattern reversed. Here is what that finding does and does not support.
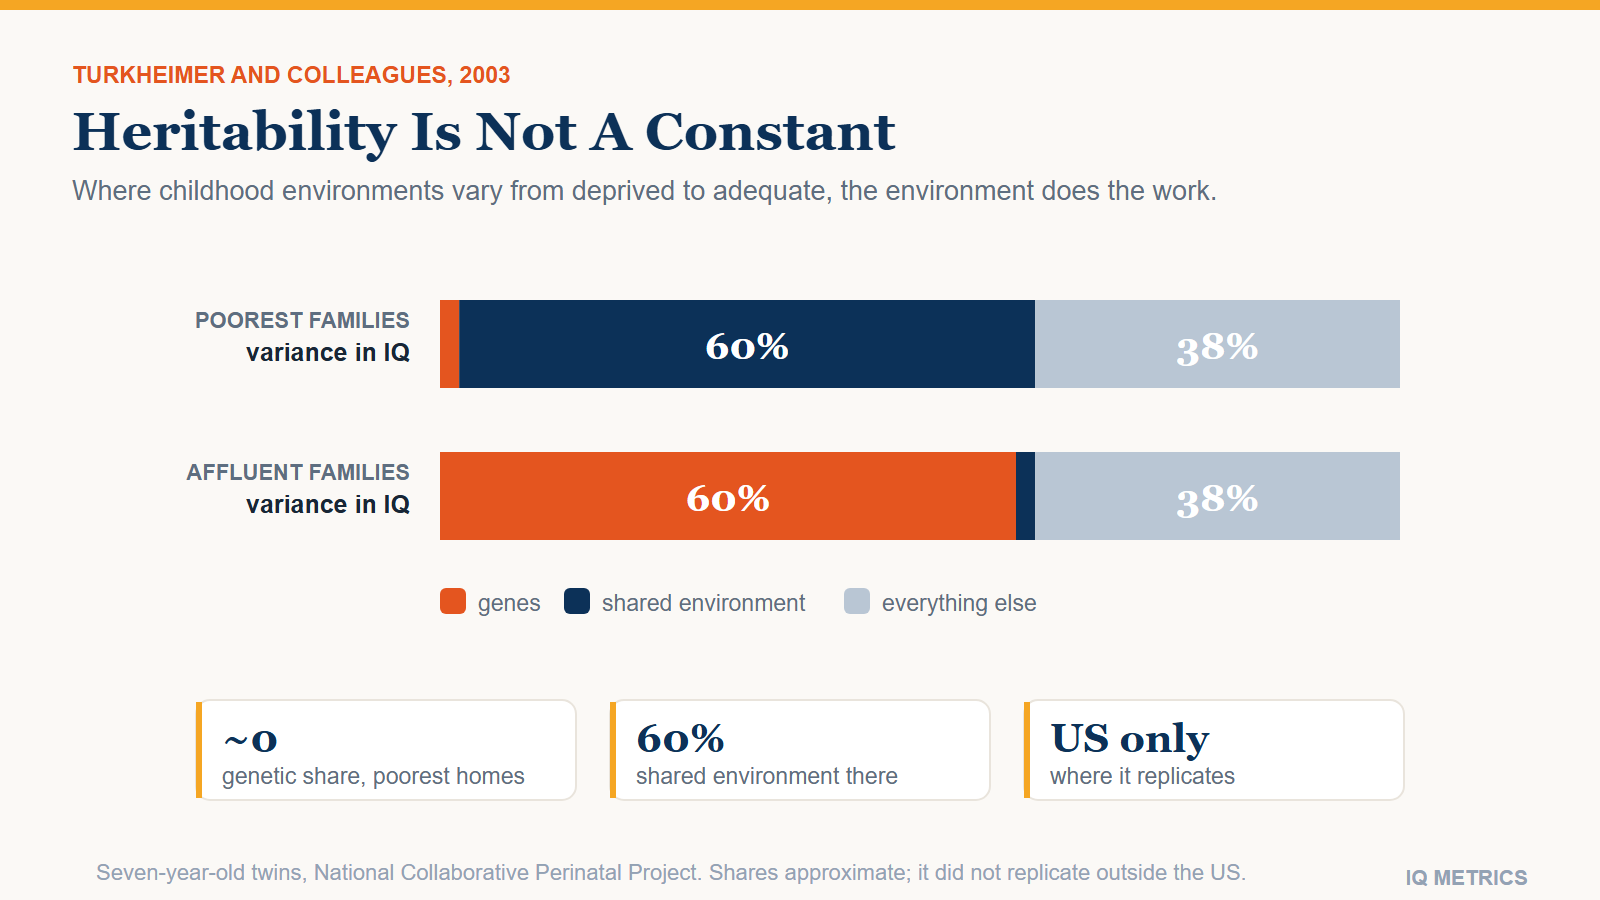
Chart showing how the heritability of IQ changes with family income in the Turkheimer 2003 twin study, with shared environment accounting for most variance in the poorest families and genes for most in affluent ones

Children from wealthier families score higher on IQ tests on average. That much has been in the literature for a century and is not seriously disputed. The interesting part is the shape of the relationship, because socioeconomic status does not merely shift scores up and down — in the best-known study of the question it changed how much heritability itself explained. That result is genuinely surprising, it has been partly replicated and partly not, and it is routinely overstated in both directions.

This article covers the size of the gap, the gene-environment interaction behind it, the adoption evidence that comes closest to a natural experiment, and the mechanisms that plausibly carry the effect. It is about the arrow running from circumstances to scores. The arrow running the other way — whether a score predicts what you go on to earn — is a separate question, covered in the evidence on IQ and income.

How large is the gap

Across studies, measures of family socioeconomic status correlate with childhood IQ at somewhere around 0.3. That is a real association and a moderate one: it means status accounts for something like a tenth of the variation in scores, and that the distributions overlap heavily. Plenty of children from poor families score above the average for rich ones. A correlation of this size is a fact about populations and close to useless as a prediction about a person.

The correlation is also not one clean variable. Household income, parental education and parental occupation each contribute, they are entangled with each other, and they are entangled with genetics too, since the parents passing on the environment are also passing on the genes. Untangling that is what the twin and adoption designs below exist to do, and it is why an unadjusted income-to-score correlation is the weakest evidence in this article rather than the strongest.

Turkheimer: heritability itself changes with income

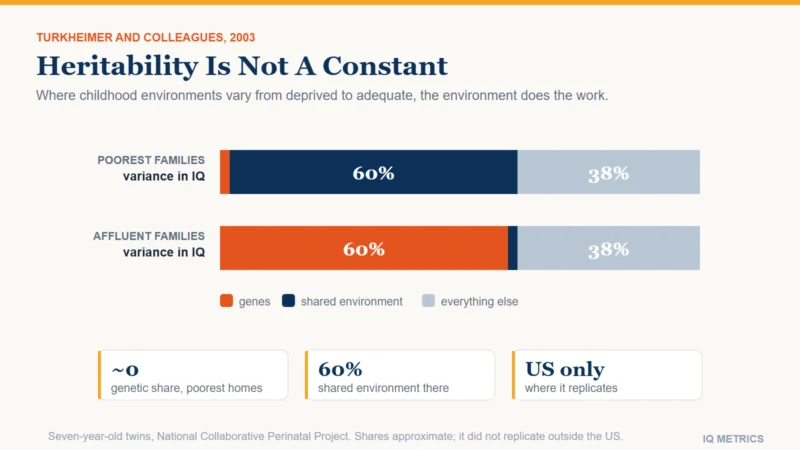
In 2003 Eric Turkheimer and colleagues analysed IQ scores from seven-year-old twins in the National Collaborative Perinatal Project, a sample with an unusually large number of families at or below the poverty line — which matters, because most twin studies draw from comfortable volunteers and so cannot see the bottom of the range at all. Instead of estimating one heritability for the sample, they let the genetic and environmental components vary as a function of socioeconomic status.

The result: in the poorest families, shared environment accounted for roughly 60 percent of the variance in scores and the genetic contribution was close to zero. In affluent families the pattern was approximately reversed. The interpretation that follows is not that genes matter less for poor children in some mystical sense. It is that genetic potential expresses itself only to the extent that the environment permits it. Where conditions vary from adequate to excellent, the remaining differences between children are largely genetic. Where conditions vary from deprived to adequate, the environment is doing the work — it is the binding constraint.

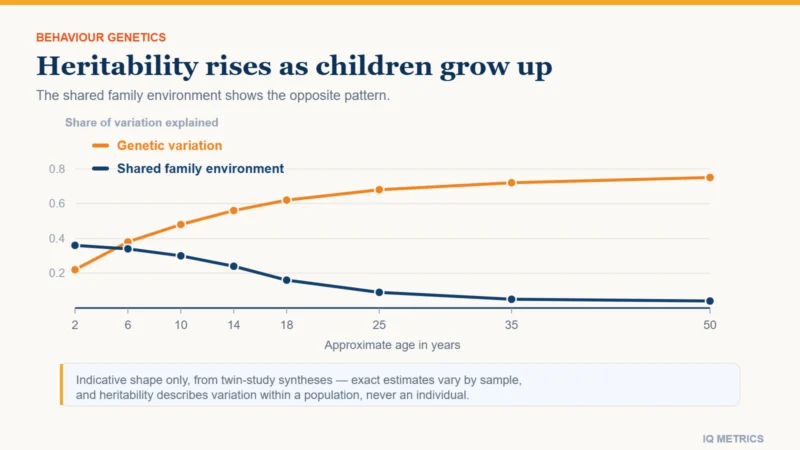
This is a genuinely important qualification to the standard heritability figure quoted for adult IQ, and it sits alongside rather than against the twin-study evidence on heritability. A heritability estimate is not a constant of nature; it is a description of one population in one set of conditions.

Chart showing how the heritability of IQ changes with family income in the Turkheimer 2003 twin study, with shared environment accounting for most variance in the poorest families and genes for most in affluent ones

Why the finding did not replicate everywhere

The honest version of this story includes the replication record, which is mixed in an informative way. A 2016 meta-analysis by Tucker-Drob and Bates pooled the studies that had tested this interaction. They found it, on average, in United States twin samples — though accounting for less variance than the original headline suggested. In samples from Europe, England and Australia they did not find it at all.

That cross-national split is a result in itself rather than a failure. The most straightforward reading is that the interaction appears where the bottom of the income distribution is genuinely deprived and disappears where a welfare floor, universal healthcare and more evenly funded schools compress the range of childhood environments. On that reading the finding is not about income as such, but about how bad the worst environments in a country are allowed to get — which is a testable claim, and one reason the question is still open.

Your own number

Where would your own score land?

Take the IIF-certified assessment and get your score with the scale it was measured on, the percentile it corresponds to and the confidence range around it — the three figures most online tests leave out.

Find your IQ score now! →

Secure & encryptedInstant results10–20 minutes

Adoption studies: the closest thing to an experiment

Twin designs infer environmental effects; adoption designs move children between environments, which is as close to a natural experiment as this field gets. The clearest example is a 1999 French study by Michel Duyme and colleagues, which found 65 children who had been adopted between the ages of four and six after abuse or neglect, and whose measured IQ before adoption was below 86 — the group averaged 77.

Reassessed in adolescence, all of them had gained, and how much depended on where they landed. Children adopted into low-status families gained 7.7 points on average. Children adopted into high-status families gained 19.5. Same starting range, same country, same age at placement, and a twelve-point difference attributable to the adoptive home. Two things make this unusually persuasive: the pre-adoption score is measured rather than assumed, and adoptive placements are not made at random but also are not made by the birth families, which breaks the usual confound between the genes a child inherits and the home they grow up in.

Note the direction it points. Even in the best-placed group the gain did not erase the differences between individual children, and pre-adoption scores still predicted post-adoption ones. Environment moved every child substantially; it did not make them interchangeable.

What actually carries the effect

“Socioeconomic status” is a proxy, not a mechanism. It stands in for a bundle of things that each have their own evidence, and the bundle is why the association is robust even though no single element explains much.

  • Environmental toxins. The dose-response relationship between childhood lead exposure and lost cognitive ability is one of the better-established findings in the field, and exposure tracks housing age and neighbourhood — see the evidence on lead.
  • Nutrition, particularly early and particularly iodine and iron deficiency, where the effects are largest in the populations that are most deficient. What diet does and does not do is narrower than the supplement market suggests.
  • Schooling. Quantity of education raises scores measurably, and access to it is unevenly distributed; the natural experiments on schooling put the effect at a few points per year.
  • Chronic stress and instability, which affect working memory and attention directly and also affect test-day performance, overlapping with test anxiety.
  • Language exposure, which loads onto the crystallized half of a score far more than the fluid half — a distinction that matters for interpretation and is set out in the fluid and crystallized article.

What this evidence does not support

Three inferences get drawn from this literature that it will not carry. The first is about individuals: none of it predicts a particular person’s score from their background, and the overlap between groups is far larger than the gap between them.

The second is about groups. Heritability estimated within a population carries no information about the causes of differences between populations — this is a point of arithmetic rather than of politics, and it is the reason national IQ rankings cannot support the claims made for them. The Turkheimer finding actually sharpens the point: if the expression of genetic potential depends on the environment, then comparing groups in different environments tells you nothing clean about either.

The third is fatalism, and it is contradicted by the adoption data on its own terms. A twelve-point difference produced by where a child was placed is a large effect by any standard in this field. What the evidence describes is a constraint that can be loosened, not a ceiling that cannot.

Reading a score with this in mind

For anyone interpreting a real result, the practical upshot is that a score is a measurement taken under conditions, and the conditions are part of the reading. That is true of the test-day variables covered in the factors that affect a result and it is true over a lifetime of them. Whether beliefs about ability form another such condition is examined in the article on growth mindset.

If you want a benchmark for yourself rather than for a population, a properly normed test measures where you are now — which is the only thing any test has ever measured.

Share this article

Know someone who keeps seeing these numbers quoted without the scale they were measured on? Send it to them.

Tagged adoption studies, child development, cognitive ability, education, environment and IQ, heritability, intelligence research, IQ and poverty, IQ Science, IQ score factors, nature versus nurture, Socioeconomic Status, socioeconomic status and IQ, twin studies

Fluid vs Crystallized Intelligence

Understanding IQ

Fluid vs Crystallized Intelligence: What Each One Measures

Fluid intelligence is what you use on a problem you have never seen before. Crystallized intelligence is everything you have already banked. The distinction has survived eighty years of factor analysis because the two halves genuinely behave differently, and the clearest proof is what happens to each one as you get older.

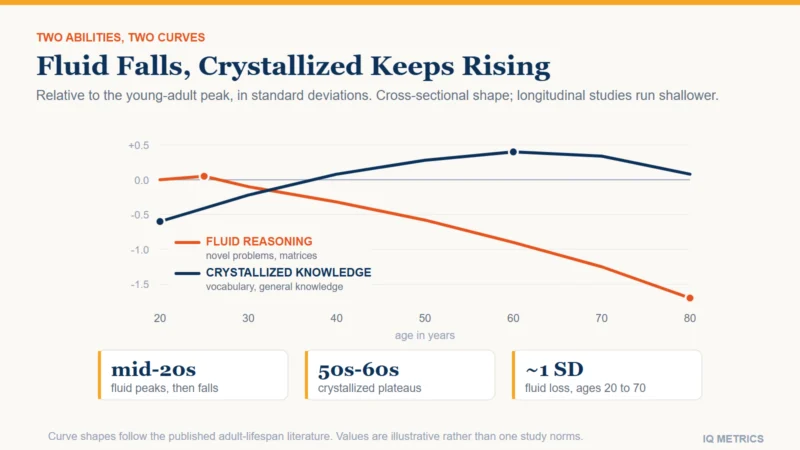
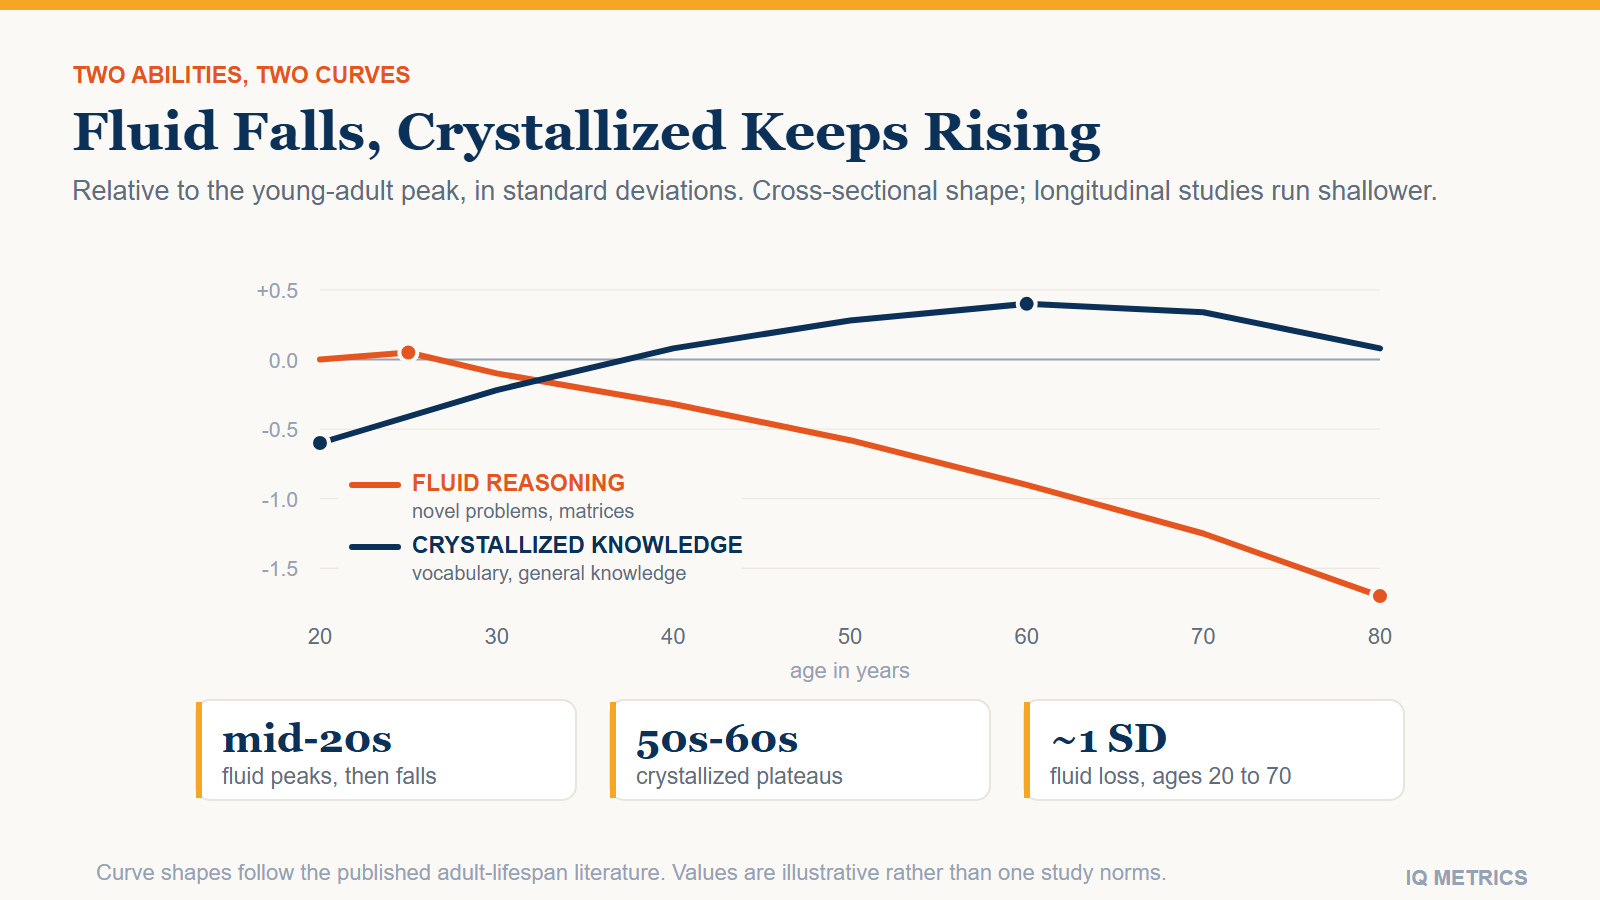
Chart of fluid and crystallized intelligence across the adult lifespan, showing fluid reasoning peaking in the mid-twenties and declining steadily while crystallized knowledge keeps rising into the sixties

Fluid intelligence is what you use on a problem you have never seen before — finding the rule in a matrix, holding several constraints in mind at once, working out a relationship nobody taught you. Crystallized intelligence is everything you have already banked: vocabulary, facts, procedures, the accumulated residue of what you have learned and can still retrieve. Raymond Cattell drew that line in the 1940s and it has outlasted most of its rivals, because the two halves are not just conceptually tidy. They load on different subtests, they respond differently to schooling, and across a lifetime they move in almost opposite directions.

That last point is the one worth staying for. Most explanations of this pair stop at the definitions. What follows is where the split actually shows up — on a real score report, in the age curves, and in which half your own test result is sampling.

What fluid intelligence measures

The defining feature of a fluid task is that prior knowledge does not help much. A matrix item shows you a grid with one cell missing and asks which option completes it; the rule might be rotation, addition of elements, or alternation, and it is different on the next item. Nothing you studied prepares you for the specific pattern. What carries you is the ability to generate candidate rules, test them against the evidence and discard the ones that fail, all while keeping the partial answer in working memory.

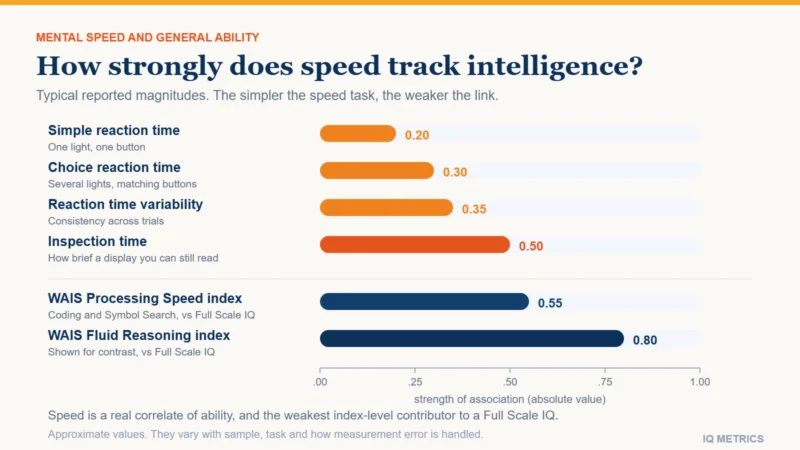
This is why Raven’s Progressive Matrices became the reference instrument for fluid ability, and why culture-fair tests are built almost entirely from figural material. Strip out the words and you strip out most of what a particular education gave you. Fluid tasks also lean heavily on how quickly you can manipulate information, which is why processing speed correlates with fluid scores far more than with verbal ones.

What crystallized intelligence measures

Crystallized ability is knowledge that has been organised well enough to be used. A vocabulary subtest is the classic measure, and it is a better one than it looks: knowing what “reticent” means is not a fact you were taught in a lesson, it is a trace of years of reading, inference and retention. General knowledge and verbal-similarities items work the same way. They ask what has stuck, not what you can work out now.

The common objection — that this is just measuring privilege or trivia — is half right and worth taking seriously. Crystallized scores are more sensitive to schooling and to language background than fluid ones, which is exactly what makes them useful for some purposes and a liability for others. That trade-off is the substance of the cultural bias argument, and it applies unevenly across the two halves rather than to “IQ tests” as a block.

Where the two split on a score report

On a professionally administered test the distinction is not theoretical, it is printed. The Wechsler Adult Intelligence Scale is the most widely used adult battery, and its fifth edition, published in 2024, made the split sharper than before by breaking the old Perceptual Reasoning Index into two: a Visual Spatial Index and a Fluid Reasoning Index. Alongside them sit Verbal Comprehension, Working Memory and Processing Speed.

  • Verbal Comprehension — vocabulary, similarities, general information. This is the crystallized index in all but name.
  • Fluid Reasoning — matrix reasoning and figure weights, plus quantitative and inductive items. Novel problems, minimal prior content.
  • Visual Spatial — block design and visual puzzles; spatial manipulation split out from reasoning proper.
  • Working Memory and Processing Speed — the machinery both halves run on, reported separately because they can fail independently.

A single full-scale number averages all of this into one figure, which is precisely what hides the interesting result. Someone can sit two standard deviations apart on Verbal Comprehension and Fluid Reasoning and still land near 100 overall. That is why clinicians read the index scores before the composite, and why a report that gives you only one number has thrown away most of what the testing session found. If you are looking at a report now, reading it index by index is the difference between a label and information.

Chart of fluid and crystallized intelligence across the adult lifespan, showing fluid reasoning peaking in the mid-twenties and declining steadily while crystallized knowledge keeps rising into the sixties
Your own number

Where would your own score land?

Take the IIF-certified assessment and get your score with the scale it was measured on, the percentile it corresponds to and the confidence range around it — the three figures most online tests leave out.

Find your IQ score now! →

Secure & encryptedInstant results10–20 minutes

The age curves are the strongest evidence

If fluid and crystallized ability were the same thing wearing two names, they would age the same way. They do not, and the gap is large. Fluid reasoning peaks in the mid-twenties and declines from there at roughly two-hundredths of a standard deviation per year, with the slope steepening after the mid-fifties. Between ages 20 and 70 that adds up to something between three-quarters of a standard deviation and a full one — eleven to fifteen points on the familiar scale.

Crystallized ability does the opposite. Vocabulary and general knowledge climb through middle age, plateau somewhere in the fifties and sixties, and hold up until quite late in life. This is the resolution of an old puzzle: people plainly get better at their work into their fifties while getting measurably slower at unfamiliar puzzles. Both things are true, of different abilities. The pattern is set out in more detail in the evidence on when intelligence peaks.

One honest caveat. Most of these curves come from cross-sectional data — different people of different ages measured at one time — and that design confounds ageing with generational differences in schooling and nutrition. Longitudinal studies that follow the same people tend to show the fluid decline starting later and running shallower. The direction of the two curves is not in dispute; the exact age at which the fluid one turns down is.

Investment theory: where crystallized ability comes from

Cattell did not propose two unrelated faculties. His investment theory says crystallized ability is what fluid ability turns into when it is spent on a culture: the child with more reasoning capacity extracts more from the same lesson, book or conversation, and that advantage accumulates as knowledge. It is a compounding account, and it explains two things a two-independent-abilities model cannot.

First, why the two correlate substantially rather than being independent — they share a cause and one feeds the other. Second, why they come apart with age exactly as they do: once the deposit is made, crystallized ability keeps paying out even as the fluid capacity that built it declines. It also predicts that an extra year of school should move crystallized scores more than fluid ones, which is roughly what the schooling evidence finds. Cattell’s pair was later folded into the broader Cattell-Horn-Carroll model that most modern batteries are built on, one of the theories that shaped IQ testing, and both sit underneath the general factor described in the account of g.

Which half is your online test measuring?

Almost always the fluid half, and mostly for practical reasons. Figural and matrix items can be generated in quantity, scored without judgment and used across languages, none of which is true of a vocabulary subtest that has to be normed against a specific population. So a short online reasoning test is sampling something real, but it is sampling one side of the pair. The distinction between the verbal and non-verbal halves of a score is the same split seen from the other direction.

The practical consequence: if your online result sits well below your sense of your own vocabulary and knowledge, that is not necessarily a contradiction, and neither number is lying. Full clinical batteries measure both because both are real. What those batteries look like is covered in the guide to professional IQ tests.

What this means for your own score

Three things follow. Ask which half a test sampled before treating the number as a summary of your intelligence. Expect the two to diverge with age, and read a mid-life score in that light rather than as decline across the board. And be sceptical of any claim to have raised “your IQ” that does not say which half moved: training reliably shifts crystallized measures, because that is what learning is, while moving fluid ability has proved far harder. How much of the outcome is fixed at all is the subject of the evidence on talent against practice, and how sharply both halves track family circumstances is covered in the article on socioeconomic status.

If you want to see where you sit on the fluid side specifically, a properly normed reasoning test will tell you more in half an hour than any amount of reading about the construct.

Share this article

Know someone who keeps seeing these numbers quoted without the scale they were measured on? Send it to them.

Tagged Cattell, CHC theory, cognitive ability, crystallized intelligence, fluid intelligence, fluid reasoning, fluid vs crystallized intelligence, G Factor, general intelligence, Index Scores, intelligence research, IQ Science, matrix reasoning, verbal comprehension, wais

What Is AGI?

Understanding IQ

What Is AGI, and How Would Anyone Measure It?

Artificial general intelligence means a system that can learn and apply knowledge across the full range of tasks a person can, rather than excelling at a narrow set. The trouble is that the major labs each publish a different definition, none of them converts into a test, and so claims that AGI has arrived cannot be checked either way.

Chart comparing four published definitions of artificial general intelligence from OpenAI, Google, Microsoft and the ARC Prize Foundation, showing how little they overlap on what would count

AGI stands for artificial general intelligence: an AI system with the ability to learn, reason and apply knowledge across the full range of tasks a person can handle, rather than performing brilliantly in one narrow domain. That much is broadly agreed. Almost nothing after it is.

The organisations building these systems publish materially different definitions, none of those definitions specifies a test, and there is no reference population against which a result could be scored. So when a launch announcement is described as the arrival of AGI, there is no procedure available to check the claim. That is a measurement problem, and human intelligence testing solved a version of it a century ago.

Why nobody agrees on what AGI means

The published definitions differ on what would count, and the differences are not cosmetic.

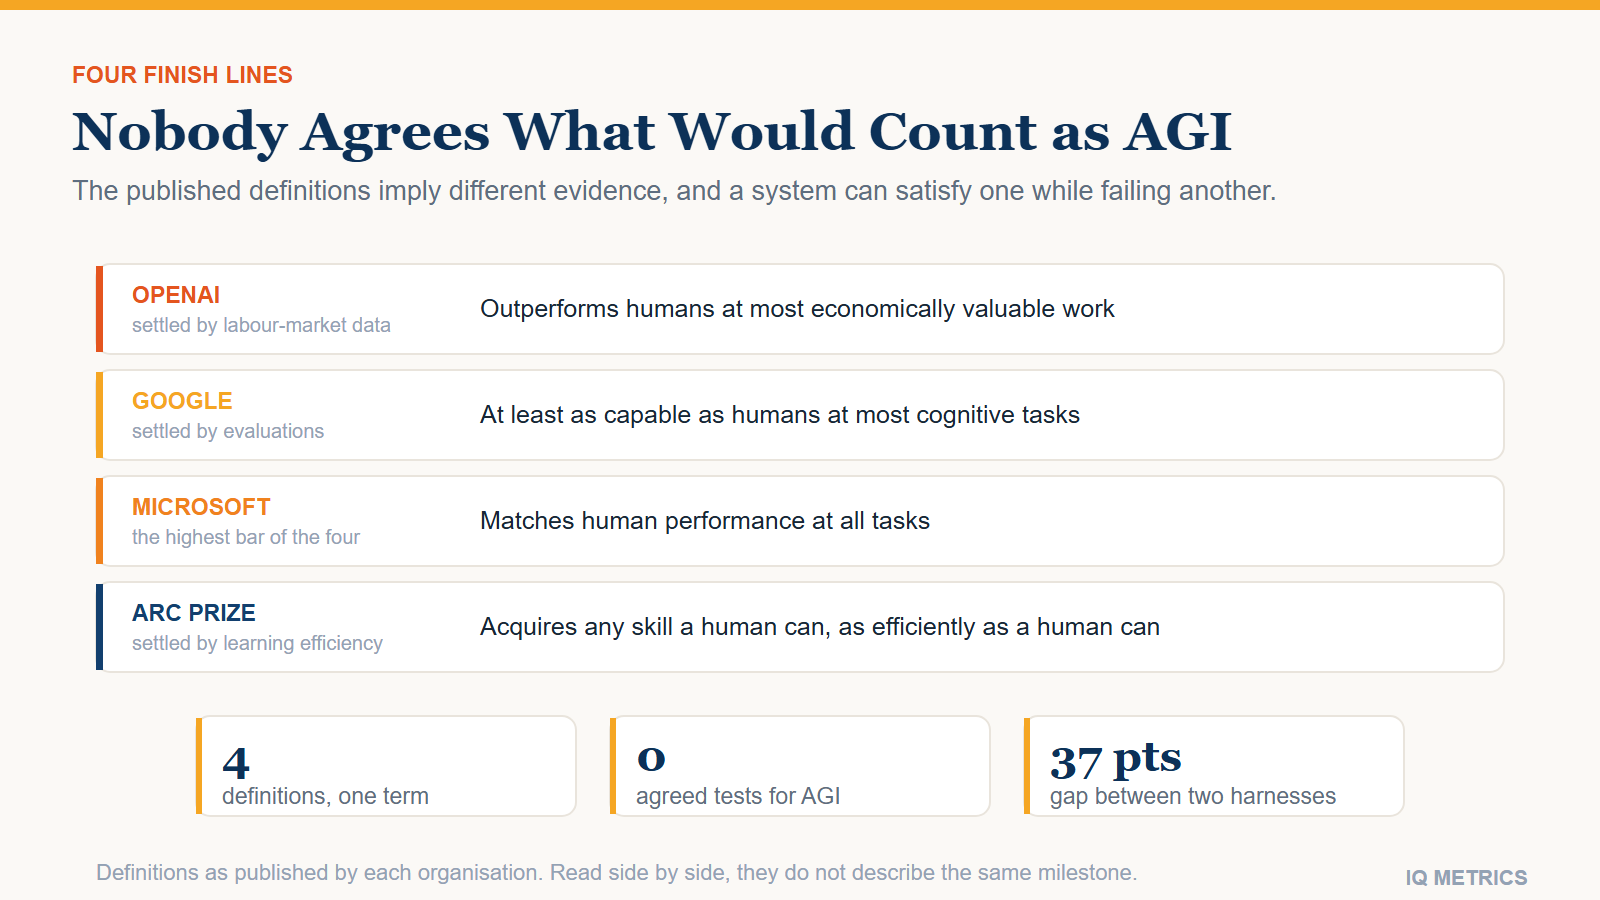
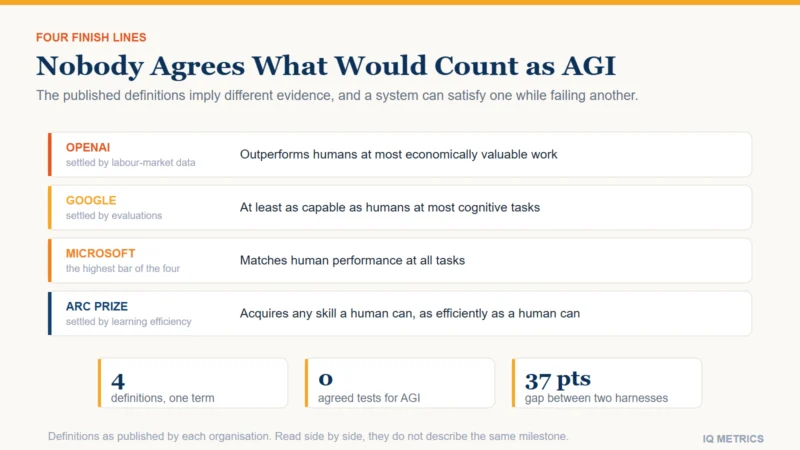
  • OpenAI: autonomous systems that outperform humans at most economically valuable work.
  • Google: AI that is at least as capable as humans at most cognitive tasks.
  • Microsoft: the point at which an AI can match human performance at all tasks.
  • ARC Prize Foundation: a system’s ability to acquire any skill a human can, as efficiently as a human can.

Read them side by side and the gaps open up. OpenAI’s is economic and could in principle be satisfied without the system ever learning anything new. Microsoft’s says all tasks, which is a far higher bar than most. The ARC Prize definition is the only one that puts learning efficiency at the centre, which is also the only version that resembles what psychologists mean by general ability.

The disagreement is not merely academic, because each definition implies a different finish line and a different set of evidence. An economic definition is settled by labour-market data. A cognitive-task definition is settled by evaluations. A learning-efficiency definition is settled by putting a system in front of something genuinely unfamiliar and counting how much evidence it needs. A system could satisfy one and fail another on the same day, which is roughly where things stand.

A term that means four things does not support a yes-or-no answer. It supports four of them.

What is the difference between AI, AGI and superintelligence?

The three terms describe a ladder, and most confusion comes from using them interchangeably.

  • Narrow AI is everything in use today: systems that perform specific tasks, sometimes far better than people, without the ability to transfer that competence to an unrelated problem. A model that writes excellent code and cannot fold a towel is narrow, however impressive the code.
  • AGI would match human ability across the full breadth of tasks rather than in a slice of them. Breadth is the operative word: the claim is about range, not peak performance.
  • Superintelligence would exceed human ability across that same full range. It is a claim about what comes after AGI, and is entirely hypothetical.

The distinction that matters for measurement is the first one. Narrow ability is straightforward to test, because you can specify the task. Breadth is not, because you would have to specify every task — which is the problem the next section is about.

How would anyone actually measure AGI?

The most serious attempt starts from a 2019 paper by François Chollet called "On the Measure of Intelligence", which argued that nearly every AI benchmark of the period measured skill at a task — and that skill at a task can simply be bought with enough data and training. What a benchmark should measure instead, on that argument, is how efficiently a system picks up a skill it was never trained on.

That produced the ARC-AGI series, built around puzzles with no vocabulary, no cultural reference and no arithmetic beyond counting, where every task has a different rule and nothing carries over. The distinction it targets is the one human testing already draws between fluid reasoning — working out something new — and crystallized ability, which is what you have accumulated. The general factor in human ability leans most heavily on the first.

Older proposals still get cited and are worth knowing. The Turing test asked whether a machine could be told apart from a person in conversation. Marvin Minsky suggested in 1970 that a machine should be able to read Shakespeare, grease a car, play office politics and tell a joke. The coffee test, associated with Steve Wozniak, proposes that AGI arrives when a machine can walk into an unfamiliar house and make a pot of coffee. Each captures something. None produces a score.

Chart comparing four published definitions of artificial general intelligence from OpenAI, Google, Microsoft and the ARC Prize Foundation, showing how little they overlap on what would count
Your own number

Where would your own score land?

Take the IIF-certified assessment and get your score with the scale it was measured on, the percentile it corresponds to and the confidence range around it — the three figures most online tests leave out.

Find your IQ score now! →

Secure & encryptedInstant results10–20 minutes

Did GPT-6 Astra just reach AGI?

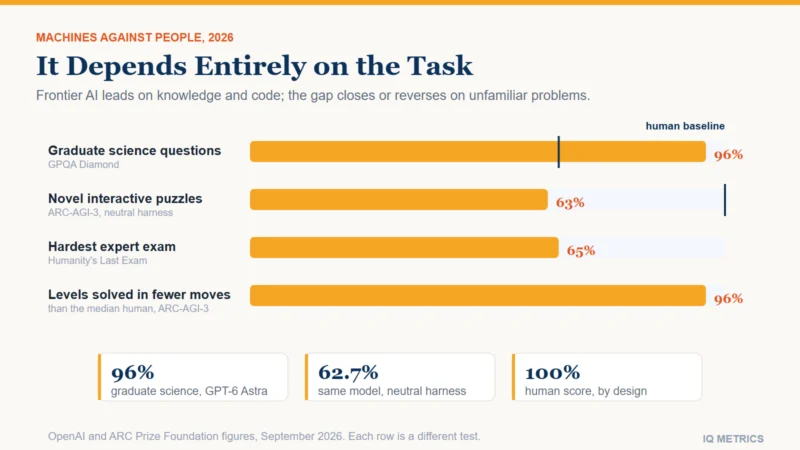
In September 2026 OpenAI announced GPT-6 Astra, and reported 99.9 percent on ARC-AGI-3 — the interactive benchmark built specifically to resist this kind of result. Coverage framed it as the arrival of the AGI era.

The organisation that owns the benchmark disagrees, in writing. The ARC Prize Foundation’s own analysis states plainly that while it believes the system represents meaningful progress towards generalisation, it is not claiming that it is AGI, and notes that it said at launch that saturating the benchmark would not represent proof of achieving AGI.

There is a measurement detail underneath that, and it is the part worth carrying away. The 99.9 percent came from a harness supplied by the model’s own developer, which preserves the system’s reasoning state between moves. On the ARC Prize Foundation’s neutral, provider-independent harness, the same model on the same benchmark scored 62.7 percent. Both numbers were published; only one of them travelled.

Two scores 37 points apart, differing only in how the test was administered, is a familiar problem to anyone who works with cognitive assessment. It is why standardised administration is part of the test rather than an afterthought, and it is a large part of why benchmark results move so fast.

What human intelligence testing already learned about this

The problem AGI research is running into now is the one that produced modern psychometrics. A raw count of correct answers tells you almost nothing on its own. To become a score it needs three things, and machine evaluation currently has none of them.

  • A defined population. A score is a position among some group. There is no population of machines and no obvious candidate for one.
  • A norming sample. The test administered under standard conditions to a representative sample, which is what converts a raw count into a scale position.
  • Standardised administration. Fixed conditions, so that two results mean the same thing. The 62.7 versus 99.9 split is exactly what its absence looks like.

Human testing has all three and is still careful: a well-reported score comes with a confidence interval, because measurement error is real and a single number overstates precision. That is the discipline behind reporting a score as a range, and it is conspicuously missing from benchmark figures quoted to one decimal place.

So how close are we?

Honestly: unanswerable as posed, and that is not evasion. Without an agreed definition and an agreed test, the distance to AGI has no units. What can be tracked is narrower and more useful — which specific abilities have fallen, which have not, and how quickly the boundary moves. On that basis the last two years have been remarkable and the remaining gaps are real, particularly around acting in the physical world and learning from very little evidence.

The claim to treat sceptically is not that progress is fast. It is that any single result settles the question. For where machines currently stand against people task by task, the domain-by-domain comparison is the companion to this article; for what happens to your own thinking as you use these systems, the evidence on cognitive debt is more concrete than any forecast. And if the underlying interest is in how general ability gets measured at all, sitting a properly normed reasoning test shows you what a century of solving this problem produced.

Share this article

Know someone who keeps seeing these numbers quoted without the scale they were measured on? Send it to them.

Tagged AGI, AI and intelligence, AI benchmarks, artificial intelligence, crystallized intelligence, fluid reasoning, G Factor, general intelligence, intelligence research, intelligence test, measurement, test norms, turing test, what is agi