IQ Metrics
IIF Certified Assessment Start IQ Test
IIF Certified Assessment

Premature Birth and IQ

Research & Evidence

Premature Birth and IQ: What Gestational Age Actually Predicts

Children born very preterm score, on average, about 0.8 of a standard deviation lower on IQ tests than children carried to term. Here is what a 2018 meta-analysis and the studies since actually found: the gestational-age gradient, what is really driving the gap, and what it does not tell you about one specific child.

Chart showing cognitive outcomes improving in a gradient across gestational age categories from extremely preterm to full term.

Children born very preterm — before 32 weeks of a typical 40-week pregnancy — score, on average, about 0.8 of a standard deviation lower on IQ tests than children carried to term. On the familiar 100-point scale, that works out to roughly 12 points, and it is one of the more consistently replicated findings in developmental research: a 2018 meta-analysis and a broader review of trends across four decades of neonatal medicine land on almost the same number. What the average obscures matters more than the average itself — the effect is graded by exactly how early a birth was, it is driven disproportionately by specific complications rather than prematurity as a single cause, and it says very little about what any one child will do.

The headline number, and what it is built from

A 2018 meta-analysis published in Developmental Medicine & Child Neurology pooled cognitive outcomes across studies of children and adolescents born very preterm and found a deficit of roughly 0.8 to 0.86 standard deviations in full-scale IQ compared with term-born controls, alongside smaller but still substantial gaps of about 0.5 standard deviations each in executive function and processing speed. A later systematic review, tracking studies published across roughly four decades, found this gap has not meaningfully narrowed over that period — worth sitting with, since intuition says survival rates and neonatal care have improved enormously over the same stretch. Better survival for the most fragile births and an unchanged average cognitive gap are not actually in tension; they describe two different things.

Preterm is a gradient, not a category

Clinicians split preterm birth into bands: extremely preterm (before 28 weeks), very preterm (28 to 32 weeks), moderate to late preterm (32 to 37 weeks), and early term (37 to 39 weeks) before reaching a full-term birth. The research does not describe a cliff at any one of those boundaries. Across studies, each additional week of gestation is associated with a higher average nonverbal IQ score — a continuous, dose-response relationship rather than a threshold effect. A separate systematic review looking specifically at early-term and late-preterm birth — children born just a few weeks early, well outside what a neonatal intensive care unit would flag as high-risk — still found small but measurable shifts in average cognitive scores relative to full term.

Gestational age and the general pattern seen in cognitive research
Category Typical gestational age General pattern in the research
Extremely / very preterm Before 32 weeks The largest average gap versus full term, and the widest spread between individual children.
Moderate to late preterm 32–37 weeks A smaller but still measurable average gap; more support commonly needed early on.
Early term 37–39 weeks Small, subtle shifts on average, detectable mainly at the group level.
Full term 39–41 weeks The reference point every comparison above is measured against.
A gradient showing that cognitive outcomes shift with gestational age at birth rather than jumping at a single preterm cutoff.
Your own number

Where would your own score land?

Take the IIF-certified assessment and get your score with the scale it was measured on, the percentile it corresponds to and the confidence range around it — the three figures most online tests leave out.

Find your IQ score now!

Secure & encryptedInstant results10–20 minutes

What is actually driving the gap

Gestational age and birth weight travel together but are not the same thing, and neither is preterm birth itself the whole story. Within the preterm-born population, specific complications of early birth predict much worse outcomes than gestational age alone would suggest. Bronchopulmonary dysplasia — a chronic lung condition that can follow the ventilator and oxygen support extremely preterm infants often need in their first weeks — is among the strongest known predictors of a lower cognitive score within this group, over and above how early the birth was. Intraventricular hemorrhage — bleeding into the fluid-filled spaces of an immature brain, graded by severity from mild (grade 1) to severe (grade 3 or 4) — is another well-documented driver, and the more severe grades carry a substantially higher risk of later cognitive and motor impairment than mild bleeds, which often resolve without a detectable long-term difference at all. Both complications become more common the earlier a birth happens, which is part of why gestational age and outcome track each other as closely as they do without gestational age itself being the entire mechanism. The gap is not identical across sexes, either — boys born preterm tend to show a somewhat larger average cognitive deficit than girls born at the same gestational age, a pattern that recurs across enough cohorts to be treated as a real, if not fully explained, sex difference rather than noise in a handful of studies.

The deficit is not spread evenly across academic skills, either. Follow-up studies through school age consistently find mathematics hit harder, on average, than reading — a pattern that recurs often enough in the preterm literature that some researchers treat early numeracy as a specific skill worth monitoring, rather than assuming a general reading-focused intervention will cover it.

Preterm birth is also not randomly distributed through the population: it is associated with lower socioeconomic status, maternal health conditions during pregnancy, and multiple pregnancies — twins and triplets are born preterm far more often than single births, which is one reason researchers studying twins for unrelated questions, such as the heritability work behind is IQ genetic, have to treat gestational age as a confound in its own right. Studies that statistically adjust for these factors find the cognitive gap shrinks — but, unlike some other early-life exposures this site has covered, it does not disappear the way it does. Prenatal smoking and IQ found that adjusting for the mother’s own cognitive ability erased most of a raw 4-point gap; for gestational age, adjustment narrows the gap but a real residual remains, which is part of why researchers treat gestational age itself, not only its social correlates, as doing genuine work.

Does the gap close as children grow up?

The effect is strongest at the earliest gestational ages and the lowest birth weights. Some domains show relative narrowing during adolescence, but studies that follow very preterm-born people into adulthood still detect measurable differences, so “catching up” turns out to be real but partial rather than complete. There is a genuinely constructive thread in this research, too: postnatal catch-up growth and nutrition in the months after NICU discharge is an active area of study, and better early growth after birth is associated with better later cognitive outcomes — one of the few pieces of this picture a family and a pediatric team can actually act on. Breastfeeding and IQ covers a related piece of the nutritional puzzle in the general population; the preterm-specific literature on post-discharge feeding finds a similar direction of effect, though the infants and the stakes involved are different.

Follow-up windows matter here, too. Several long-running cohorts have now followed people born very preterm into their twenties and thirties, and the group-level cognitive difference remains detectable that far out, even as most individuals in the cohort go on to finish school, hold jobs and live independently. Persistent does not mean disabling for most people in the group; it means the average stays measurably different, a distinction that is easy to lose in either direction — toward false reassurance, or toward false alarm.

What this means for one specific child

A population average describes a distribution, not a prediction for any individual. The spread of outcomes within the preterm-born population is wide, and a great many children born very preterm score in the average range or above. Early cognitive development does not move in only one direction, either: researchers who study early biological risk factors like gestational age and researchers who study giftedness are often looking at the same developmental window from opposite tails of the same distribution — see signs of a gifted child for what the other tail looks like. When testing is actually wanted — for a school placement decision or a developmental concern — using a child’s corrected age rather than their birth age matters for interpreting the result correctly, a point IQ testing for children covers in more detail. Early intervention services — structured developmental support offered from the first year or two after a preterm birth, rather than a wait-and-see approach — are associated with better outcomes in follow-up studies, and most neonatal follow-up clinics build a referral to these programs into routine care for infants born very preterm. That is a genuinely actionable piece of this research, in contrast to a population average that a family cannot do anything about directly.

Share this article

Know someone who keeps seeing these numbers quoted without the scale they were measured on? Send it to them.

Tagged birth cohort study, brain development, child development, cognitive development, early childhood development, fetal development, gestational age, intelligence research, longitudinal study, neurodevelopmental disorder, premature birth, preterm birth

Eye Color and IQ

Research & Evidence

Is There a Link Between Eye Color and IQ? What the Evidence Shows

There is no credible study linking eye color to IQ, and the chromosome region that determines eye color has never turned up in a genome-wide study of intelligence. Here is what the genetics actually says, where the pattern people cite really comes from, and how it compares to a correlate that does have real evidence behind it.

Diagram contrasting the single gene region behind eye color with the thousands of variants linked to measured intelligence.

No. There is no credible scientific evidence that eye color predicts IQ, and no genome-wide study of intelligence has ever turned up the genes that determine eye color as a hit. The claim keeps circulating anyway — usually naming blue eyes specifically — because it has the shape of a scientific finding without the substance behind one: a pattern that sounds plausible, no citable original study behind it, and a real but entirely unrelated geographic correlation doing the actual work.

Where the claim actually comes from

No peer-reviewed, replicated study has established eye color as a predictor of IQ. What circulates online traces to informal claims and secondary blog coverage rather than a paper anyone can cite and check, and the absence of a traceable source is itself telling. Compare that to the Mozart effect, which at least started from a real 1993 study that a great deal of media coverage then wildly overstated. Eye color and IQ does not have even a real, overstated study at its root — the claim appears to have started as an assertion and stayed one.

One useful test for a claim like this is to try to trace it backward: find the original study, read what it actually measured, and check whether later coverage still matches it. Run that test here and the trail goes cold almost immediately — article after article cites “a study” without naming one, or cites another article that does the same thing. That pattern, sometimes called a citation loop, shows up often in claims that spread because they are shareable rather than because they are true, and it is worth checking for on any surprising claim before repeating it.

Judging ability from a physical feature visible at a glance is also an old idea with a specific name — physiognomy — and a long history of being wrong. Nineteenth- and early twentieth-century physiognomy and phrenology claimed to read character and intelligence from facial structure and skull shape, and mainstream science abandoned both once they were tested properly, not because the idea sounded implausible but because the measurements did not predict anything once someone actually checked. Eye color and IQ is a smaller-scale version of the same basic move: infer an inner trait from a visible one, and skip the part where you check.

What the genetics actually says

Eye color in most people is substantially determined by a small number of well-characterized genetic variants, concentrated in one region — the OCA2 and HERC2 genes on chromosome 15 — that control how much of the pigment melanin gets deposited in the iris. It is one of the better-understood single-region traits in human genetics, which is exactly why it is such a clean test case here: if eye color predicted intelligence, that region ought to show up somewhere in the genetic study of intelligence. It does not.

Modern genome-wide association studies of cognitive ability and educational attainment, run on samples of hundreds of thousands of people, consistently find that measured intelligence is highly polygenic: thousands of common genetic variants, each nudging the odds by a tiny amount, scattered across nearly every chromosome, together accounting for a meaningful but partial share of the variation between people. Is IQ genetic covers how that architecture works and what it does and does not imply in more depth. The relevant point here is narrower: eye color and measured intelligence are governed by different genetic systems, involved in different biology — pigment production versus neurodevelopment — and the chromosome 15 region responsible for eye color does not appear on intelligence GWAS hit lists.

A genome-wide association study works by comparing the genomes of very large groups of people against a trait they vary on — eye color, height, a cognitive test score — and flagging which specific genetic locations turn up statistically associated with that trait more often than chance would predict. These studies have grown large enough, often covering hundreds of thousands or millions of genomes, that a real association of even modest size is very hard to miss. If eye color genuinely predicted intelligence, a signal at the OCA2/HERC2 region would be expected to show up in these studies by now. Across many independently run analyses, it has not.

Two different genetic systems
Eye color Measured intelligence
Number of variants involved A handful of common variants Thousands of variants genome-wide
Typical effect of one variant Can be large enough to shift a category Individually tiny
Where they sit in the genome Concentrated near chromosome 15 Spread across nearly every chromosome
Shows up in intelligence GWAS? No n/a
A schematic contrasting eye color, controlled by one small genetic region, against measured intelligence, influenced by thousands of variants spread across the genome.

The pattern people think they are seeing

Popular versions of this claim often lean on the fact that lighter eye colors are more common in Northern and Western European populations, which also show up with particular average scores in some international test comparisons, and jump straight to a genetic story. But this is the same statistical error the site has already covered from a different angle: aggregate, between-country score comparisons are shaped by differences in nutrition, schooling access and quality, test translation and norming practices, and economic history — any of which can swamp a signal from a pigmentation gene many times over, if such a signal existed at all. Average IQ by country and what country IQ rankings cannot support both work through why national comparisons are this unreliable, for reasons that have nothing to do with eye pigment.

It is also worth noticing what this kind of claim would predict if it were true, and checking whether that prediction holds up. If a pigmentation gene meaningfully affected intelligence, the effect ought to be detectable within a single family — comparing siblings who inherited different eye colors from the same two parents — not only in a comparison between entire nations with completely different histories, economies and school systems. Nobody has published that within-family comparison, because, as far as the genetics shows, there is nothing there to find.

Your own number

Where would your own score land?

Take the IIF-certified assessment and get your score with the scale it was measured on, the percentile it corresponds to and the confidence range around it — the three figures most online tests leave out.

Find your IQ score now!

Secure & encryptedInstant results10–20 minutes

Other physical traits people link to IQ the same way

Eye color is not the only physical trait that attracts this kind of claim. Height correlates weakly with measured IQ in some studies — on the order of a correlation too small to be useful for predicting any individual person — and where a real, if small, statistical association does turn up, the more likely explanation is shared early-life factors, such as childhood nutrition and health, affecting both growth and cognitive development rather than one trait causing the other. Handedness has been asked and answered separately on this site’s news desk, in are left-handed people smarter. Hand size and facial features have attracted similar claims at various points, almost always for the same underlying reason: a trait that is easy to observe at a glance is an appealing shortcut, and a shortcut does not require evidence to spread.

A real correlate, for comparison

It helps to hold this claim next to one that actually works. SAT and ACT scores also correlate with IQ, at a respectable 0.8 or so in two named, replicated studies — and that correlation has an identifiable mechanism behind it: both kinds of test sample overlapping reasoning skills under timed, unfamiliar conditions. Eye color and IQ share no comparable mechanism, no genetic overlap, and, when you go looking for the specific original study, no clear origin either. That contrast is a useful test to run on any claimed correlate: is there a plausible shared mechanism, or just two numbers that happened to move together in whatever population someone happened to look at?

Why claims like this persist

A claim that ties intelligence to something fixed, effortless and visible at a glance is a particularly sticky kind of pattern, regardless of subject matter, and pigmentation-linked claims about ability have a long and specifically ugly history of being deployed that way. None of that requires bad intent from anyone repeating it today — only that intuition is a poor substitute for a traceable source. Brain myths about intelligence and cultural bias in IQ tests cover other claims in the same family, and the pattern is consistent across all of them: naming what is missing — a real study, a plausible mechanism, a replication — is more useful than staying quiet about a claim just because it sounds scientific.

Share this article

Know someone who keeps seeing these numbers quoted without the scale they were measured on? Send it to them.

Tagged behavioral genetics, Brain Myths, cognitive bias, eye color, genetics and iq, GWAS, intelligence research, iq myths, IQ Science, is iq genetic, Neuromyths, polygenic

Signs of a Gifted Child

Understanding IQ

Signs of a Gifted Child: What the Research Actually Finds

The "reads early, has a big vocabulary" checklist misses what a 2024 systematic review actually found: an uneven cognitive profile, a documented speed-accuracy tradeoff, asynchronous development, and real gaps in who gets identified. What the research says, and what to do with a hunch.

Table comparing cognitive and psychological domains where gifted children show a research-backed advantage against domains where they do not.

The signs researchers actually find in gifted children are more specific, and less convenient, than the “reads early, has a big vocabulary” checklists that circulate online. A 2024 systematic review pulling together over a hundred studies found real, measurable differences — but unevenly: an advantage on some memory tasks and not others, faster reaction times more often than higher accuracy, and a psychological profile that carries real costs alongside the advantages. None of this substitutes for an actual evaluation, but it is a considerably better starting point than a generic list.

This is a different question from the cutoff score

It is worth separating this from a question the site has already covered from another angle. Gifted cutoff scores is about the number — why 130 is a convention rather than a discovery, and how much measurement error surrounds it. This article is about what you might actually notice in a child’s behavior and development before, or instead of, any formal number. They are related questions, and IQ ceiling effect covers a narrower, more clinical piece of the same territory: how psychologists choose an instrument for a child who may be too able for a standard test to measure accurately.

The cognitive pattern, and its limits

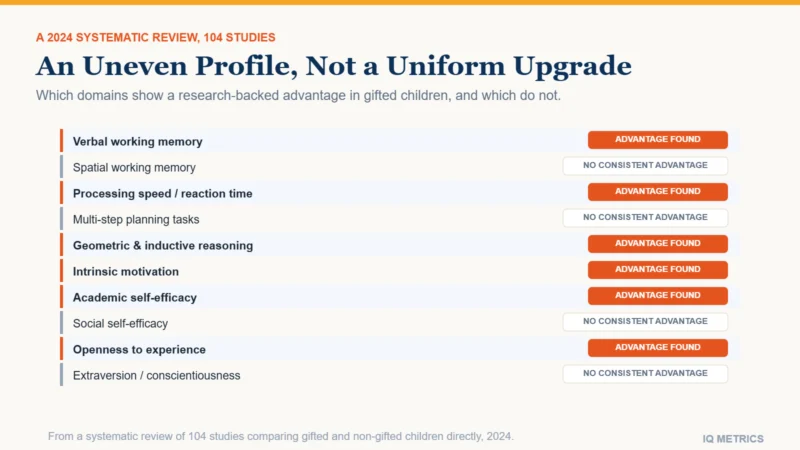
The clearest signal in the research is not a uniform upgrade across every kind of thinking — it is specific, and the specificity is more useful than a blanket claim would be. The review behind these numbers drew on 104 separate studies comparing gifted and non-gifted children directly, rather than resting on a single research group’s findings, which is part of why the unevenness in its results is worth taking seriously rather than explaining away. Five of six studies reviewed found gifted children outperforming peers on verbal working memory tasks, such as recalling a growing list of digits or words. The same children showed no consistent advantage on spatial working memory tasks. Processing speed turned up as a genuine pattern too: gifted children were faster across a majority of reaction-time comparisons, roughly 70–83% depending on the specific task, though the review documented a real speed-accuracy tradeoff — a child is not necessarily both faster and more accurate on the same task, just more likely to be ahead on one of the two.

What a 2024 systematic review actually found, by domain
Domain What the research found
Verbal working memory (digit span, word recall) Advantage found in most studies
Spatial working memory (block-tapping tasks) No consistent advantage
Processing speed / reaction time Faster in a majority of comparisons, not all
Planning (multi-step puzzle tasks) No consistent advantage
Geometric and inductive reasoning Advantage found
Intrinsic motivation Higher, consistently across studies
Academic self-efficacy Higher
Social self-efficacy No consistent difference
Openness to experience (Big Five) Higher
Extraversion, agreeableness, conscientiousness No consistent difference

Two negatives in that table matter as much as the positives: no advantage on classic multi-step planning tasks, and no broader “gifted personality” beyond openness to experience. Giftedness, in the research, is not a general-purpose upgrade — it is a specific profile with real gaps in it.

A comparison of cognitive and psychological domains where research finds a measurable advantage in gifted children versus domains where it does not.
Your own number

Where would your own score land?

Take the IIF-certified assessment and get your score with the scale it was measured on, the percentile it corresponds to and the confidence range around it — the three figures most online tests leave out.

Find your IQ score now!

Secure & encryptedInstant results10–20 minutes

Asynchronous development: the pattern behind the confusing part

The National Association for Gifted Children uses the term asynchronous development for something many parents notice before any test result: a child’s cognitive, social, emotional and physical development proceeding at different rates in the same child, and the gap between them tends to widen as measured ability increases. A child reading two grade levels ahead and also having an outsized meltdown over a minor frustration is not showing two unrelated traits — it is frequently the same underlying pattern, viewed from two different angles. In practice, this often shows up years before any formal testing: a preschooler reading simple books independently while still needing help with shoelaces and taking turns is displaying the same pattern, not two unrelated facts about one child. The systematic review found only limited data on children under six specifically — just 22 of the 104 studies it covered looked at that age range — so some caution is warranted about how far the more granular cognitive findings above extend to toddlers and preschoolers. What does hold up at every age in the broader literature is the asynchronous-development pattern itself: intellectual development running ahead of social, emotional or physical development, rather than all four moving together.

Heightened sensitivity to criticism and failure shows up repeatedly in this literature, and so does boredom driven by a curriculum pitched at age rather than ability — one of the most common presenting complaints, and one that is sometimes read as an attention or behavior problem rather than what it usually is: a mismatch problem. The same intensity that shows up as heightened sensitivity has a well-documented flip side, too: a tendency toward perfectionism, where the gap between a child’s own standards and what they judge themselves capable of becomes a source of real distress rather than motivation. This is not itself a research-established cognitive marker in the way the findings above are, but it recurs often enough in clinical and educational accounts to be worth naming alongside the better-evidenced material.

The psychological profile, and who gets missed

Beyond the cognitive pattern, the review found gifted children consistently report higher intrinsic motivation and higher academic self-efficacy than peers — but not higher social self-efficacy, an asymmetry worth knowing about if a child seems confident about schoolwork and considerably less so about friendships. On personality measures, the only consistent difference was higher openness to experience; extraversion, agreeableness and conscientiousness did not reliably differ from peers.

Gifted children in the review also earned higher grades and performed better on standardized exams, which will surprise nobody — but it is worth being precise about what that finding is and is not. Better achievement is a downstream outcome of ability plus schooling plus motivation together, not an early sign in the way a working-memory or processing-speed advantage is. A struggling grade in one subject does not rule out giftedness, and a strong one does not confirm it on its own.

Identification research adds a separate, important caveat: real giftedness goes unrecognized in well-documented, systematic ways. Quiet, compliant, high-achieving children who do not match a teacher’s mental picture of what giftedness looks or acts like are routinely missed, and so are children in families who are simply unaware a referral pathway exists at all. Universal screening for gifted programs covers the policy side of closing that gap.

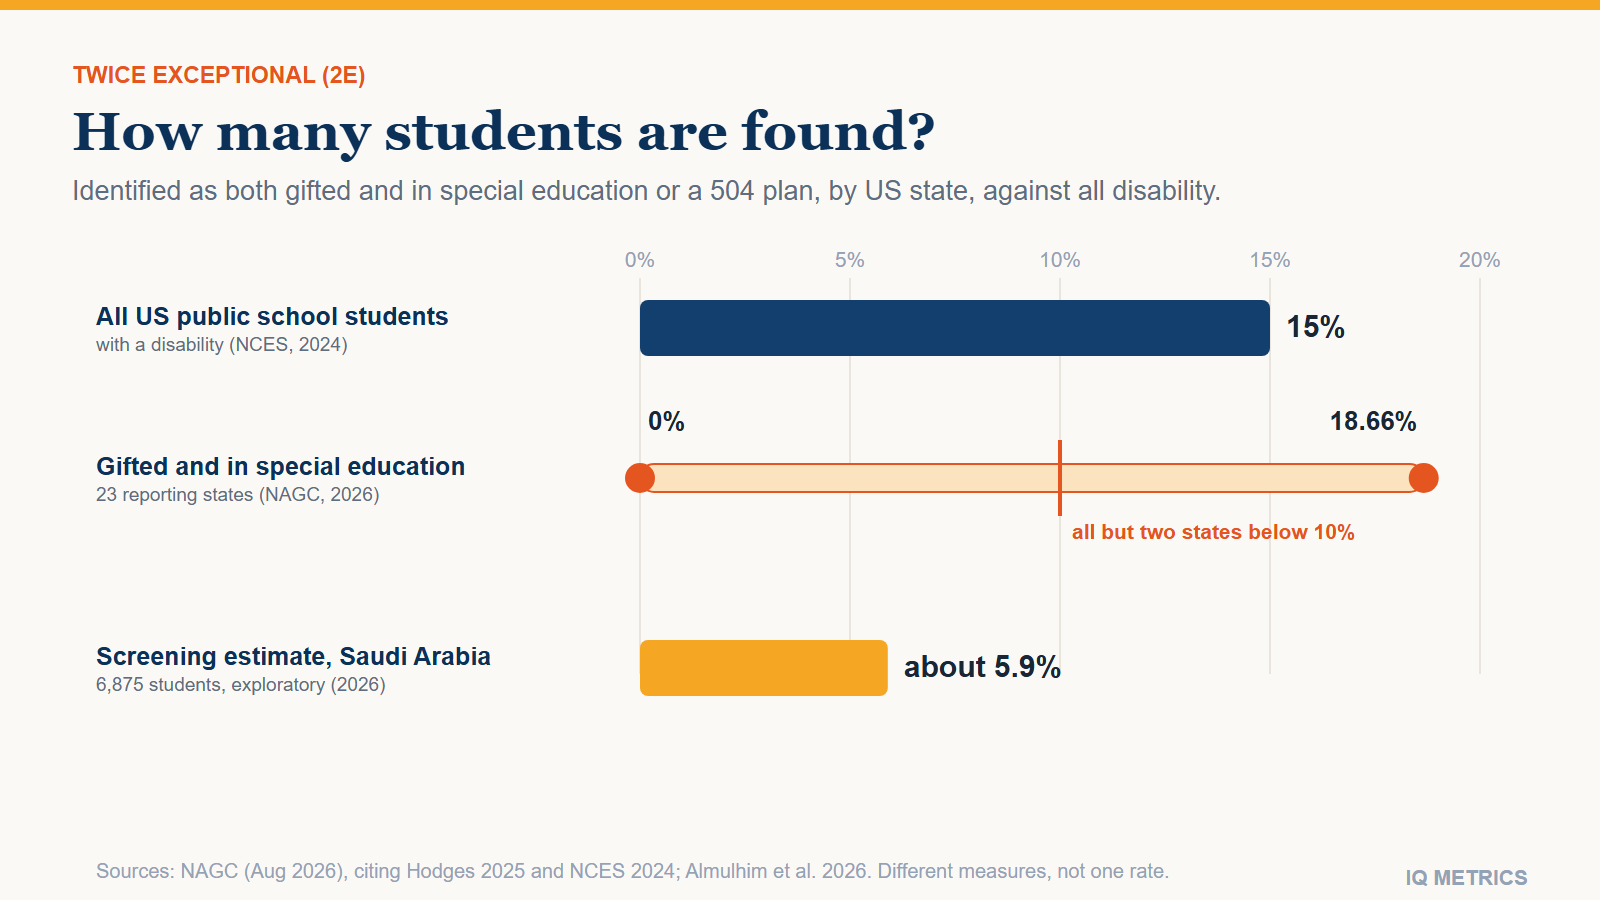
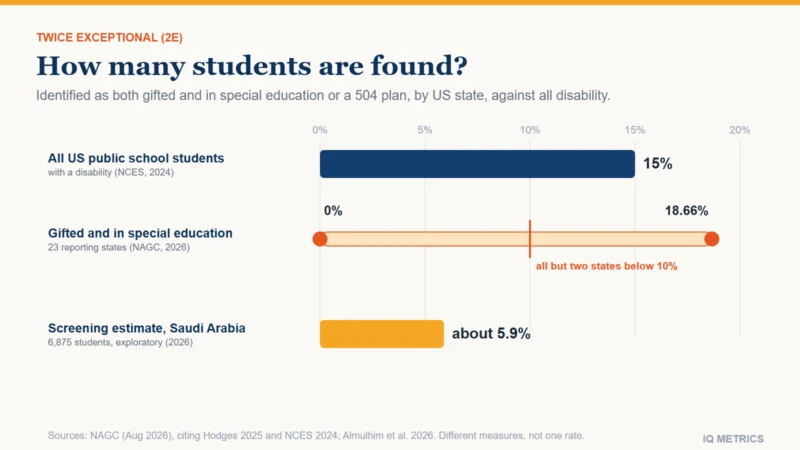
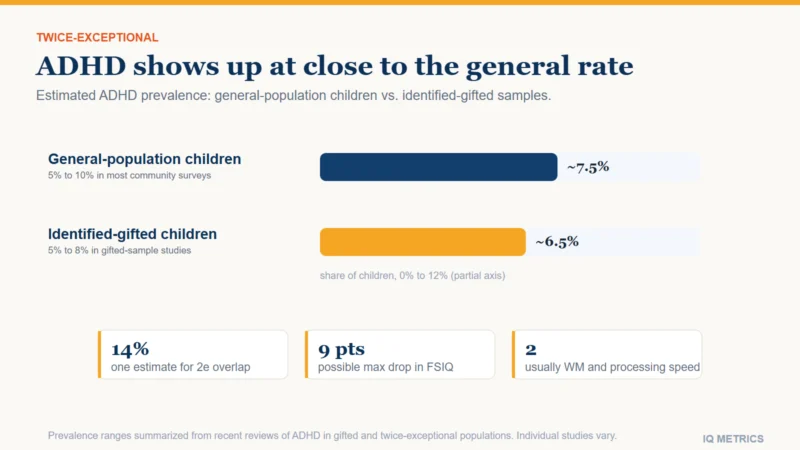
A second, separate way giftedness gets missed deserves its own mention: a child can be genuinely gifted and also have a learning disability, ADHD, or an autism spectrum diagnosis at the same time — sometimes described as twice-exceptional. In these children, strong verbal reasoning can mask a real reading disorder, or intense focus on a preferred subject can be misread as the opposite of an attention difficulty. Each condition can hide the other from a casual observer, which is one more reason a pattern-match against a list, including this one, is not a substitute for an evaluation by someone looking at the whole child.

What to do with a hunch

A single behavior on a single day is not a pattern. What research and experienced evaluators both look for is consistency across time and context — the same trait showing up at home, at school and with peers, not only in the one setting where a parent happens to be watching most closely. A teacher, a pediatrician, or a school psychologist can all be a reasonable first conversation, and none of them requires a firm conclusion going in — “here is the pattern I am noticing, and here is why I think it is worth a closer look” is a complete and useful starting point.

Everything above describes patterns, not a diagnosis. Early cognitive development does not move in only one direction, either — for a look at the other tail, what early biological risk factors such as gestational age predict rather than early advantage, see premature birth and IQ. The only way to get an actual number, rather than a pattern-match against a research summary, is an actual assessment. IQ testing for children covers what that process involves and when it tends to make sense, and the kids IQ test is built specifically for this age range, with a report meant to be read together rather than delivered as a verdict.

Share this article

Know someone who keeps seeing these numbers quoted without the scale they were measured on? Send it to them.

Tagged asynchronous development, child development, child iq, child iq testing, cognitive development, early childhood development, gifted children, gifted cutoff, gifted identification, iq testing for children, kids iq test, profoundly gifted

Sleep and IQ

Research & Evidence

Sleep and IQ: What Chronic Sleep Loss Does to a Developing Brain

This site’s news desk has already covered what one bad night does to a test score on the day it is taken. This is a different and, for children especially, more consequential question: what years of too little sleep do to the cognitive systems an IQ test measures in the first place.

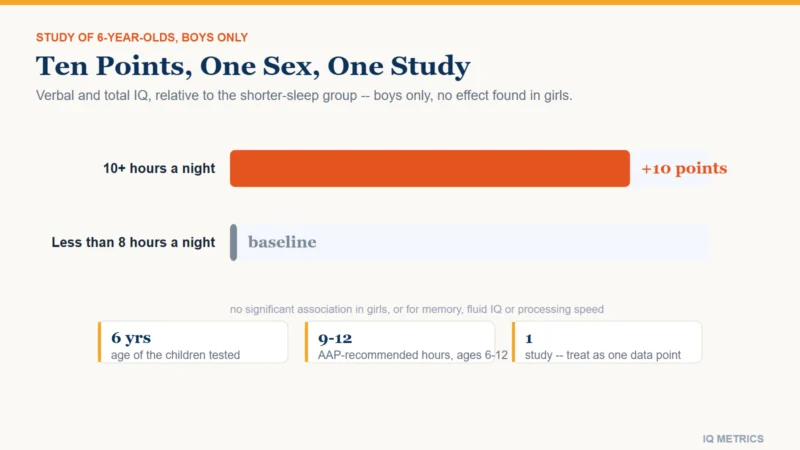
Bar chart comparing verbal and total IQ scores in six-year-old boys by sleep duration: about 10 points higher in boys sleeping 10 or more hours a night versus boys sleeping less than 8 hours

A single bad night blunts attention, working memory and processing speed for that one sitting, without touching a person’s underlying ability — that acute, test-day question is covered in full on this site’s news desk. This article is about something slower, and for children in particular, potentially more consequential: what chronic sleep duration, sustained across months and years of development, does to the cognitive systems an IQ score is built to measure in the first place, and how sleep’s role in memory itself may explain part of the connection.

A study built to test exactly that question

A study out of Seoul National University’s Environmental Health Center, working with Hanyang University Medical Center, measured habitual sleep duration in a group of six-year-old children and tested their IQ directly. Boys who slept 10 or more hours a night scored roughly 10 points higher on verbal and total IQ than boys sleeping less than 8 hours. That is a large gap for a single study to carry, and the honest reading requires the details that come with it: the association held for boys but not for girls, and it held specifically for verbal and total IQ, not for memory, fluid IQ, processing speed or attention measured separately in the same children. Treat this as one well-designed but sex-specific and domain-specific data point, not a settled general finding that more sleep raises IQ across the board.

Why an effect this size would show up in boys and not girls is not settled by the study itself, and this article will not pretend otherwise. Sex differences in the timing of early brain development are a documented, general phenomenon in child developmental research, which makes a sex-specific result plausible rather than suspicious on its face — but plausible is not the same as explained, and a single study finding an effect in one sex and not the other is exactly the kind of result that most needs an independent replication before it hardens into a general claim about boys and sleep.

Bar chart comparing verbal and total IQ scores in six-year-old boys by sleep duration: about 10 points higher in boys sleeping 10 or more hours a night versus boys sleeping less than 8 hours

The mechanism: what sleep is actually doing

The leading explanation is systems memory consolidation: during sleep, especially slow-wave sleep, newly formed memories held in the hippocampus are gradually transferred into longer-term storage distributed across the neocortex. Cut that process short night after night, the theory goes, and a child accumulates a deficit in exactly the kind of durable knowledge and skill consolidation that both school performance and IQ testing draw on. Several studies suggest this consolidation process may run faster, or more efficiently, in children than in adults — which would help explain why sleep’s cognitive stakes look especially high during the exact developmental window most of this research focuses on. A separate strand of research on napping specifically has found that even a short daytime nap can improve retention of material learned just beforehand in young children, which is consistent with the same underlying mechanism operating on a shorter timescale than a full night’s sleep, not only across it.

Longer-run evidence, not just one snapshot

A 2023 prospective cohort study, tracking sleep-duration trajectories from early childhood forward rather than measuring sleep once, found that children on a persistently short-sleep trajectory showed poorer visual-spatial performance later on and a higher risk of scoring in the low range on Full-Scale IQ. Separate research on toddlers, ages 1 to 3, found that shorter naptimes and a lower ratio of sleep to wake time were linked to cognitive outcomes measured at age 4, which in turn connected indirectly to Full-Scale IQ measured at age 6 — a longer causal chain than the single cross-sectional study above, but pointing the same direction across a different age range and a different research design. What makes a trajectory study more persuasive than a single snapshot is exactly that it can separate a child who is a naturally short sleeper on the night of testing from a child whose sleep has been short consistently for years; the two are easy to confuse in a one-time measurement and considerably harder to confuse once sleep has been tracked over time.

Your own number

Where would your own score land?

Take the IIF-certified assessment and get your score with the scale it was measured on, the percentile it corresponds to and the confidence range around it — the three figures most online tests leave out.

Find your IQ score now!

Secure & encryptedInstant results10–20 minutes

When sleep is disrupted by more than a late bedtime

Pediatric obstructive sleep apnea, a physical airway obstruction that fragments sleep independent of how early a child goes to bed, offers a genuinely useful natural check on the pattern above. Children and teens with moderate to severe sleep-disordered breathing average about half a letter grade lower in school than children without it — a consistent finding across multiple studies. Office-based IQ testing specifically is less consistent: the clearest IQ deficits show up in preschool and early grade-school years, with results in older children more mixed. Worth being precise about that distinction rather than collapsing it: the academic-performance effect of disrupted sleep is well established across ages, while the direct IQ-score effect is better supported at younger ages specifically than at older ones. The value of the OSA evidence here is not the size of any one number; it is that airway obstruction fragments sleep for reasons that have nothing to do with a family’s bedtime habits, income or parenting choices, which makes it a cleaner natural test of "does fragmented sleep itself affect cognition" than a survey asking parents to report how many hours a child usually sleeps. That the pattern points the same direction as the habitual-duration research above, using a completely different mechanism of sleep loss, is what makes it a useful cross-check rather than a repeat of the same finding.

How much sleep is actually recommended

  • Infants, 4 to 12 months: 12 to 16 hours per 24, naps included
  • Ages 1 to 2: 11 to 14 hours per 24, naps included
  • Ages 3 to 5: 10 to 13 hours per 24, naps included
  • Ages 6 to 12: 9 to 12 hours a night
  • Teens: 8 to 10 hours a night

Those figures come from the joint American Academy of Pediatrics and American Academy of Sleep Medicine consensus guidance, and regularly sleeping below them is independently associated with attention, behavior and learning problems, separate from the IQ-specific findings described above.

What this means, and does not mean

None of this says that a single late bedtime, one missed hour on one particular night, costs a child real IQ points, any more than one single skipped meal by itself causes real malnutrition. It says something narrower and better supported: sustained sleep duration across months and years of development is consistently linked to cognitive outcomes across several independent lines of evidence — a cross-sectional study in six-year-olds, a longitudinal cohort tracking trajectories rather than single measurements, toddler research on napping specifically, and a physically distinct disruption pathway in sleep apnea — even though no single one of those studies is airtight on its own, and even though the sex-specific result in the headline study deserves the caution given to it above. That kind of convergence across different designs and different ages is a genuinely stronger form of evidence than any one striking number, and it is why sleep belongs on the same short list as the other directly modifiable factors connected to cognitive outcomes on this site, alongside the mechanics of memory covered in this site’s piece on memory and IQ and the developmental window discussed in testing IQ in children. A related, physical and frequently under-diagnosed cause of fragmented childhood sleep is worth ruling out where it applies, since some of its attention and behavior effects overlap with what is separately discussed in this site’s piece on ADHD, autism and dyslexia. And the same underlying idea — a limited daily cognitive resource, protected or spent down by how someone lives — is covered from an entirely different angle in this site’s companion piece on multitasking and IQ, which is about dividing attention during the day rather than losing consolidation time at night.

Share this article

Know someone who keeps seeing these numbers quoted without the scale they were measured on? Send it to them.

Tagged academic performance, brain development, child development, cognitive development, early childhood, intelligence research, IQ Science, memory consolidation, pediatric sleep, sleep and iq, sleep apnea, sleep duration, Working Memory

Multitasking and IQ

Research & Evidence

Does Multitasking Lower Your IQ? What the Research Shows

No study has measured a person’s IQ before and after a bout of multitasking. What researchers at Stanford measured instead is narrower and more surprising: heavy multitaskers, tested against the exact skill they practice constantly, turned out to be worse at it, not better.

Bar chart comparing task-switching response times between heavy and light media multitaskers: heavy multitaskers 426 milliseconds slower on switch trials and 259 milliseconds slower on nonswitch trials, Stanford study 2009

No study has measured a person’s IQ before and after a bout of multitasking and found it dropped, and none has followed people over years to see whether heavy multitasking causes a lasting change in general intelligence. What researchers have measured is narrower and, in its own way, more interesting: chronic heavy multitaskers perform measurably worse on the exact cognitive skills an IQ test leans on most — filtering out irrelevant information, holding items in working memory, and switching cleanly between tasks. The researchers who first tested this in the lab expected the opposite result, which is a large part of why the finding is worth taking seriously.

The study that expected the opposite result

A 2009 Stanford study published in the Proceedings of the National Academy of Sciences set out to answer a specific question: do people who chronically juggle several media streams at once develop better cognitive control as a result of all that practice? The researchers built a media multitasking index from a questionnaire covering twelve forms of media, then compared "heavy" multitaskers (one or more standard deviations above the average number of simultaneous streams) against "light" multitaskers (one or more below) on a battery of established cognitive-control tests. The working hypothesis, reasonable on its face, was that heavy multitaskers should show an advantage at managing multiple streams of information, since that is exactly what they do all day.

What they actually found

In a filter task requiring participants to track two target shapes while ignoring a variable number of distractor shapes, heavy multitaskers’ accuracy fell steadily as distractors were added; light multitaskers’ accuracy did not move at all, meaning they filtered out the irrelevant shapes completely while heavy multitaskers let more and more of them in. A related test asked participants to hold a letter cue in mind and respond only when a specific follow-up letter appeared, sometimes with an unrelated distractor letter shown in between. With no distractor present, the two groups performed identically. Adding the distractor changed that: heavy multitaskers slowed down noticeably while accuracy stayed the same for both groups, meaning the extra letter was genuinely pulling their attention rather than confusing either group about the rules of the task. A separate test of raw impulse control, a stop-signal task requiring participants to withhold an already-triggered response, found no difference between the groups at all — heavy multitaskers were not simply more impulsive across the board, only more susceptible to letting irrelevant information in. A third test, a memory-updating task requiring participants to ignore letters that had appeared earlier but were no longer relevant, found the same pattern: heavy multitaskers’ false-alarm rate — mistaking an old, irrelevant item for a current target — climbed faster as the task went on. Across three independently designed tests, the direction of the effect was consistent: heavy multitaskers let more irrelevant information into working memory, not less, while showing no general deficit in impulse control on its own.

Bar chart comparing task-switching response times between heavy and light media multitaskers: heavy multitaskers 426 milliseconds slower on switch trials and 259 milliseconds slower on nonswitch trials, Stanford study 2009

The task-switching result specifically

The most direct test compared how much slower each group got when a trial required switching from one type of task to a different one, versus repeating the same task type. If heavy multitasking practice built genuine switching skill, heavy multitaskers should have shown a smaller penalty. They showed a larger one: 167 milliseconds greater than light multitaskers’, a statistically solid difference. The detail that matters most is that heavy multitaskers were slower even on trials that did not require switching at all — 259 milliseconds slower on repeat trials, on top of 426 milliseconds slower on switch trials. That rules out an explanation limited to "switching itself is the problem"; something about sustained, single-task focus was affected too, not only the transition between tasks.

Your own number

Where would your own score land?

Take the IIF-certified assessment and get your score with the scale it was measured on, the percentile it corresponds to and the confidence range around it — the three figures most online tests leave out.

Find your IQ score now!

Secure & encryptedInstant results10–20 minutes

What this does not show

The study’s own authors were explicit that the direction of cause and effect is unresolved, and this article carries that caveat forward rather than smoothing it over: chronic multitasking could cause weaker filtering and switching ability, or people who are already less able to filter distraction could simply be drawn toward multitasking behavior more than people who filter well. A follow-up summary of a decade of subsequent research, published by Stanford in 2018, described a consistent memory-performance gap between heavy and light multitaskers across many later studies — and reported the same causal-direction question still unresolved a decade later. The sample in the original study was also a group of university students tested once, not a general population followed over time, which limits how far any single number here should be generalized. The researchers themselves floated a specific version of the reverse-causation possibility worth stating directly: someone who already struggles to sustain focus on one thing might find single-tasking uncomfortable and gravitate toward switching between several activities precisely because it suits a mind that already has trouble filtering, rather than multitasking behavior creating that difficulty from scratch. Either story is consistent with the same data, and only a study that follows the same people over years, watching multitasking habits and cognitive-control ability change together or apart, could tell them apart. That study has not been done yet.

What the switching cost looks like outside the lab

A separate line of research, distinct from the Stanford trait-based comparison above, has measured the practical cost of interrupting one task to handle another. The American Psychological Association, summarizing task-switching research, estimates that switching between tasks can consume up to 40 percent of someone’s otherwise-productive time. A 2009 study on what researchers call "attention residue" found that a portion of attention stays with an unfinished task even after switching away from it, measurably impairing performance on whatever comes next. Neither of these findings is about IQ or general intelligence either — they describe a real, practical cost to interrupting focused work, on top of, and separate from, the cognitive-control differences described above. A widely cited 2005 field study of office workers found that more than half of observed work tasks were interrupted before completion, with an average delay of roughly 25 minutes before the original task resumed. That number describes a single workplace observational study, not a laboratory measure of cognitive ability, and it varies enormously by job and by how the interruption is defined; it is included here as context for how large the practical cost of switching can look outside a controlled experiment, not as a second data point for the cognitive-control findings above.

So, does multitasking lower your IQ

Not in any sense a test can measure directly, and nobody has run the study that would settle it either way. What the evidence does support is narrower and arguably more useful: treating multitasking as a skill that improves with practice, the way learning an instrument or a language does, is not what the data shows. The Stanford research points toward the opposite pattern — constant practice at dividing attention correlating with getting worse, not better, at the specific mental skills, filtering distraction and holding focus, that an IQ test also draws on. Whether that is cause, effect or a bit of both for any one person is a question this research has not answered yet.

Where this fits next to the site’s other coverage

This is a different mechanism from this site’s piece on AI and cognitive offloading, which covers what happens when someone delegates a single thinking task to a tool rather than doing it themselves; multitasking is about dividing attention across several tasks at once, a distinct question with its own separate research base. It sits more naturally next to processing speed and IQ and memory and IQ as another way a specific, trainable-feeling mental skill turns out to have a more complicated relationship to general cognitive performance than intuition suggests. The same underlying theme — a limited cognitive resource, spent well or poorly — shows up from a completely different angle in this site’s piece on sleep and IQ, which is about losing hours of consolidation time rather than splitting attention during the day.

Share this article

Know someone who keeps seeing these numbers quoted without the scale they were measured on? Send it to them.

Tagged attention, cognitive control, cognitive science, digital age cognition, distraction, executive function, intelligence research, IQ Science, media multitasking, multitasking, productivity, Stanford study, task switching, Working Memory