IQ Metrics
IIF Certified Assessment Start IQ Test
IIF Certified Assessment

Do Video Games Raise Your IQ?

Mind & Everyday Life

Do Video Games Raise Your IQ? Near Transfer vs Far Transfer

Action video games produce real, replicated gains in spatial ability and attention, some of the best near-transfer evidence in this batch. Push the test further away, toward the general reasoning an IQ test measures, and the effect all but disappears once the research is pooled properly.

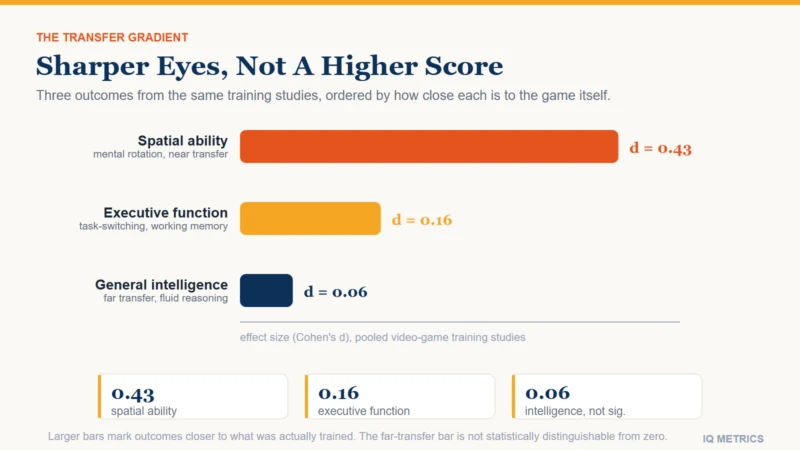
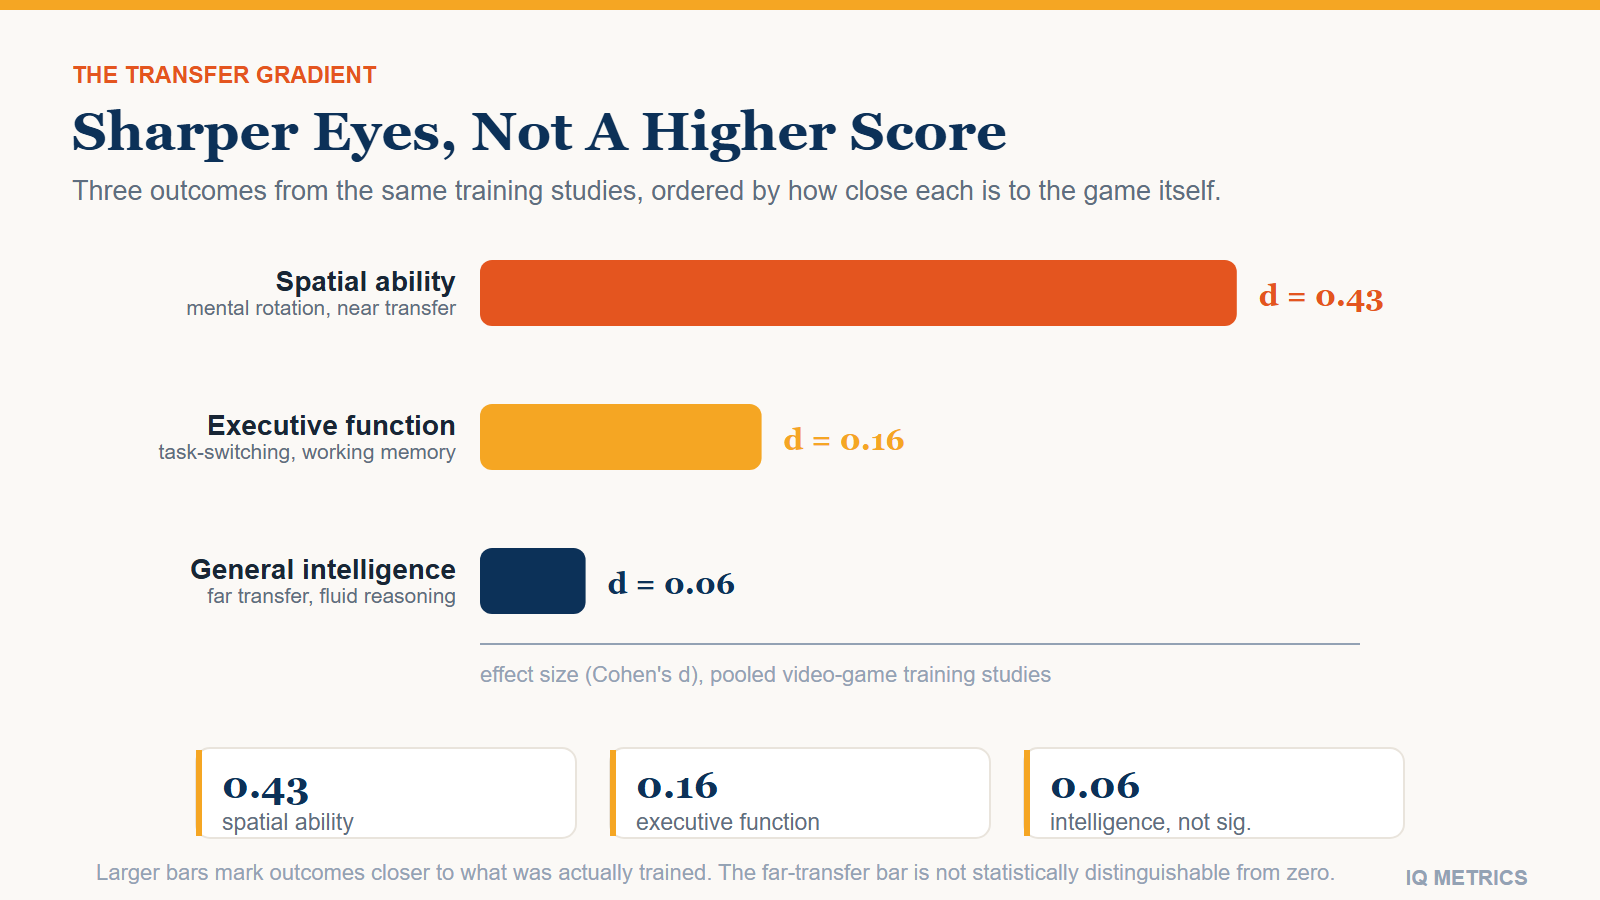
Horizontal bar chart of video game training effects by skill, showing a moderate improvement in spatial ability, a small improvement in executive function, and almost no measurable change in general intelligence test scores

For a narrow set of specific skills, yes: well-controlled studies find real improvements after training on action video games. For general intelligence — the broad reasoning ability an IQ test is built to capture — the answer from the same body of research is close to no. The gap between those two findings is the whole story, and it is a cleaner version of the same near-transfer, far-transfer pattern that shows up with chess.

That comparison is worth making explicit, because chess and video games have been studied with a similar structure and hit a similar wall: real, replicated gains on the trained task and its closest neighbours, and gains that shrink toward nothing the further the test sits from what was actually practiced. The two questions even share a villain: early studies with no proper comparison group, which is exactly the design flaw that inflated the first wave of both literatures before better-controlled follow-ups brought the estimates back down.

What gets sharper

The clearest, most replicated finding in this literature concerns a fairly narrow skill: mental rotation and other tests of spatial ability, where meta-analyses combining dozens of training studies find a moderately strong improvement after action-game practice. Related measures of visual attention — how much of a busy screen someone can track at once, how quickly they find a target among distractors — move in the same direction, though usually by less.

Executive-function tasks, which cover things like switching between rules or holding several items in mind while working with them, show a real but small average improvement across studies. It is a genuine effect, not noise, but it is a fraction of the size of the spatial-ability finding, and it varies a lot from one study to the next.

Not all video games are the same

Almost all of the research behind the spatial-ability and attention findings comes from one specific genre: fast-paced action games, usually shooters, that demand tracking multiple moving targets under time pressure. That is a deliberate choice by researchers, not an accident — the genre plausibly exercises visual attention and spatial tracking more directly than most other kinds of game — but it also means the finding does not automatically generalize to gaming as a whole.

Puzzle games, city-builders and slower strategy titles have been studied far less, and what research does exist finds effects, when present at all, on narrower skills that match whatever the specific game demands rather than on spatial ability broadly. The honest version of this article’s headline claim is narrower than “video games raise your IQ” or even “video games sharpen your mind”: it is closer to “a specific, well-studied genre reliably sharpens a specific, narrow set of visual and attention skills.”

What does not move

None of the genre caveat changes the picture for the specific genre that has actually been tested. Push the test further from the game itself, toward the kind of abstract pattern-matching an IQ test actually uses, and the effect all but disappears. A comprehensive pooling of the video-game training literature put the average improvement in measured intelligence at essentially zero once study quality was accounted for — smaller than the executive-function effect, and not reliably different from no effect at all.

  • Spatial ability. A real, moderately sized improvement — the strongest finding in the field.
  • Executive function. A real but small improvement, well short of spatial ability.
  • General intelligence. No reliable improvement once the studies are pooled properly.
Horizontal bar chart of video game training effects by skill, showing a moderate improvement in spatial ability, a small improvement in executive function, and almost no measurable change in general intelligence test scores
Your own number

Where would your own score land?

Take the IIF-certified assessment and get your score with the scale it was measured on, the percentile it corresponds to and the confidence range around it — the three figures most online tests leave out.

Find your IQ score now! →

Secure & encryptedInstant results10–20 minutes

Who these studies actually tested

It is a fair question, and worth asking directly. Most of this research compares people who already play action games heavily against people who do not, or takes non-gamers and puts them through several weeks of training in a lab. Both designs have a real limitation. The comparison studies cannot fully separate “gaming made these people sharper” from “people who were already sharper in this specific way found gaming more rewarding and stuck with it” — the same selection problem that comes up with chess players. The lab-training studies handle that better by assigning people randomly, but they mostly recruit young adults over a few weeks, which says little about children, older adults, or what happens after months or years rather than weeks.

Brain training apps are a different, weaker story

It is worth separating action video games, the subject of the research above, from commercial brain-training apps built specifically to raise IQ or memory scores. That literature has been reviewed on its own, and it fares worse than the action-game research: the trained tasks are usually closer to the test used to measure improvement, which inflates near-transfer scores without producing anything that looks like a durable change in general ability. A game built to be fun and only incidentally demanding on attention has, perversely, produced more convincing evidence than software built explicitly to train cognition.

This is not a fringe opinion inside the field. A group of cognitive scientists published an open letter warning that brain-training marketing was running well ahead of the evidence, and in the United States regulators fined at least one major brain-training company over advertising claims a court found were not adequately supported. None of that means the underlying tasks are useless as puzzles — it means the specific claim “this software will raise your IQ or stave off cognitive decline” has repeatedly outrun what the data backing it could support.

What sharper attention is actually worth

None of this makes the spatial and attention gains trivial. Faster, more accurate visual search and better mental rotation are useful in their own right — they plausibly touch some real-world tasks that lean on quick visual judgment — and they are large enough and reliable enough that a skeptical reader should not lump them in with the null result for general intelligence. What they are not is a stand-in for it. Processing speed is one of the specific abilities an IQ test does sample, and it is plausible some gaming-related gains touch it, but a faster reaction on a screen is a narrower thing than the reasoning an intelligence test is built to measure.

Some of the clearest demonstrations involve a measure called useful field of view: how much of a cluttered scene someone can take in and correctly identify in a single brief glance, without moving their eyes. Trained action-game players reliably outperform non-gamers on this measure, and non-gamers who are put through a training program show real gains within weeks. It is a genuinely useful skill outside a game, relevant to noticing a hazard at the edge of vision while driving, for instance — but it is a specific visual skill, not a general reasoning one, and it says little about how someone would perform on a matrix-reasoning IQ subtest that shows abstract shapes with no visual clutter to search through at all.

So should you game for a smarter brain

If the goal is a higher IQ score, action games are not a proven route to one, and the same is true of software marketed specifically as brain training. If the goal is a set of sharper, well-documented attention and spatial skills, the evidence for that is genuinely good. Those are different claims, and cognitive-training marketing has a long history of blurring them; this page on improving IQ covers what the wider evidence does and does not support, and reading is a useful contrast — a very different activity that moves a very different, more crystallized kind of ability instead.

The same test applies to anyone hoping a screen-based habit will double as brain training: ask what genre was actually studied, what the comparison group did, and whether the outcome measured was close to the game itself or genuinely far from it. A narrow, honest claim — “this sharpens visual attention” — has survived scrutiny here. The broader one has not.

Share this article

Know someone who keeps seeing these numbers quoted without the scale they were measured on? Send it to them.

Tagged brain training, cognitive training, executive function, far transfer, fluid intelligence, how to increase iq, Improving IQ Scores, intelligence test, IQ Science, near transfer, Practice Effect, publication bias, spatial ability, video games and iq

Does Chess Raise Your IQ?

Mind & Everyday Life

Does Chess Raise Your IQ? What the Research Actually Shows

Chess is one of the oldest test cases for a big question: does practicing a demanding mental skill make you generally smarter, or just better at that skill? The honest summary from decades of research: real for chess itself, modest for a couple of related skills, and close to zero for general IQ.
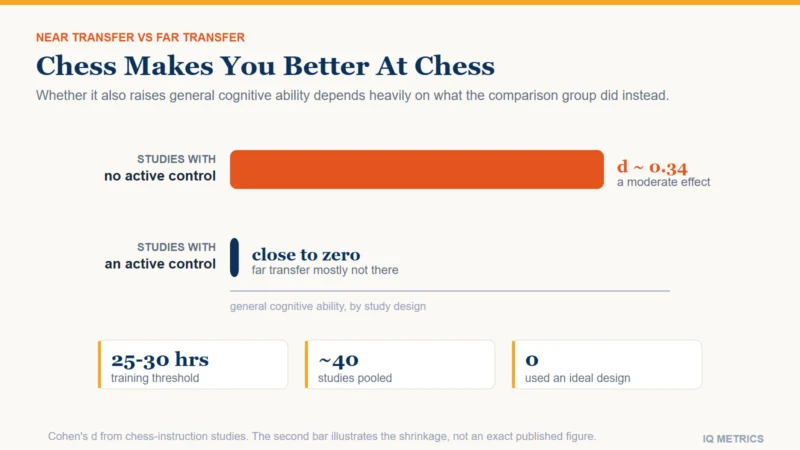
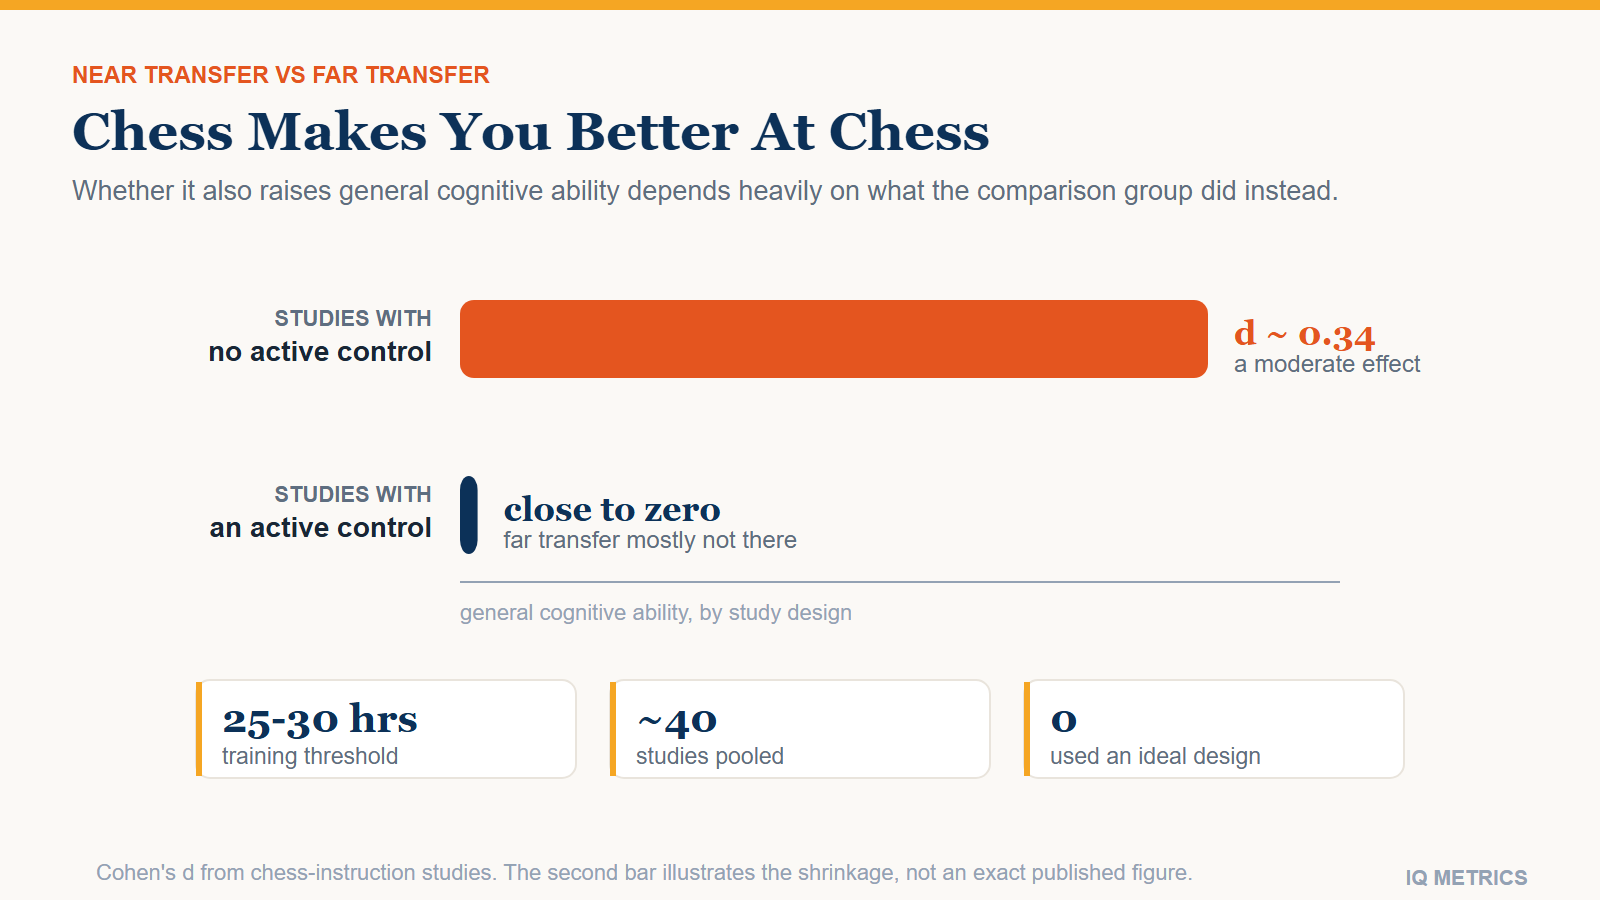
Bar chart comparing chess training study results, showing a moderate effect on general cognitive ability in studies with no active control group, shrinking to near zero in the better-designed studies that used one

No, not in the way most people hope. Chess reliably makes you better at chess, and with enough structured instruction it appears to help a little with school subjects that lean on planning and working memory, particularly math. The evidence that it raises general intelligence — the kind an IQ test measures — is much weaker, and it gets weaker still in the studies built to rule out the obvious alternative explanations. That gap between the two claims is worth understanding rather than just accepting, because the same pattern — a confident headline about “raising IQ” resting on evidence that only ever supported a narrower, less exciting claim — shows up across most of the games, apps and hobbies marketed the same way.

That pattern — a real effect on the skill itself, a smaller and shakier one on anything further away — shows up again almost exactly with video games, which this article treats as a companion piece. Both are examples of the same question asked about a different activity: does deliberately practicing a demanding mental skill make you smarter overall, or just better at that skill?

What the raw numbers show

Pooling roughly forty studies of children given structured chess instruction, one widely cited analysis reported a moderate association with general cognitive-ability scores, and a similar or slightly larger one with math achievement specifically. Reading and literacy scores moved less. On the numbers alone, chess looks like a genuinely useful classroom activity.

Two details in the same body of research matter before taking that at face value. The size of the effect tracked how much chess the children actually did: benefits showed up reliably only once a class had logged somewhere around 25 to 30 hours of instruction, roughly a school year of one lesson a week. And the authors of the underlying review were explicit that no single study in it used what they considered an ideal design, so a placebo-like effect from novelty and extra adult attention could not be ruled out. That is not a small caveat in a literature this size: it means the best-supported number available is also, by the reviewers’ own account, an upper bound rather than a settled estimate.

Why the number shrinks when you look closer

That second caveat turned out to matter a great deal. Most of the early chess-and-cognition studies compared a chess class against doing nothing different at all, which leaves the comparison unable to separate three things that all point the same direction: chess itself, structured attention from an instructor, and simply doing something new and engaging instead of a normal lesson.

The same research group later re-ran the comparison using only studies where the control group did a different structured activity of their own, rather than nothing. Their own paper described the result in its title: negative evidence for far transfer. Once novelty and extra attention are matched on both sides, the boost to general cognitive ability mostly is not there. What survives is much closer to zero than the raw 0.34 figure above suggests.

Bar chart comparing chess training study results, showing a moderate effect on general cognitive ability in studies with no active control group, shrinking to near zero in the better-designed studies that used one

Are strong players just smart people who chose chess

There is a second, separate question hiding inside the first one: are the best chess players in the world unusually high in IQ to begin with? Loosely, yes — competitive players as a group score above the general population average on cognitive tests, the way people who stick with any demanding hobby tend to skew toward whatever trait makes that hobby rewarding. But among players who already compete seriously, differences in tournament rating track hours of deliberate, structured study far more closely than they track differences in general intelligence scores. Two players with similar ratings can differ substantially in IQ, and two players with similar IQs can differ by hundreds of rating points depending on how they trained.

That is worth remembering the next time a very strong player’s IQ gets quoted as though it explained their rating. Magnus Carlsen and Garry Kasparov are both, by any measure, exceptionally strong players; neither’s rating is well explained by IQ alone, and both logged the kind of practice hours this research keeps landing on as the real driver.

Your own number

Where would your own score land?

Take the IIF-certified assessment and get your score with the scale it was measured on, the percentile it corresponds to and the confidence range around it — the three figures most online tests leave out.

Find your IQ score now! →

Secure & encryptedInstant results10–20 minutes

Chess, bridge and dementia risk in later life

A related and often-repeated claim is that chess and similar games protect older adults against cognitive decline and dementia. The observational evidence pointing that way is real: large studies following older adults over years have found that people who regularly play chess, cards or similar strategy games show a lower rate of later dementia diagnosis than people who do not.

The catch is a familiar one in this kind of research. Dementia has a long preclinical phase, often many years, during which subtle cognitive changes can make demanding hobbies less appealing well before any diagnosis is made. People already, invisibly, on the path to decline may simply stop playing chess first, which would produce exactly this pattern even if chess itself did nothing protective at all. Randomized trials, which could rule that out, are far smaller and shorter than the observational studies, and the question has not been settled either way.

What chess is actually good evidence for

Set the far-transfer question aside and the chess research is genuinely informative about something else: what deliberate practice does to the skill it targets, and how narrowly that tends to stay put. One of the more careful studies in this literature found chess instruction improved children’s meta-cognitive habits inside math problem-solving specifically — noticing when a plan is not working, checking an answer against the question — without a matching jump in general test scores. That is near transfer: chess did not make the children smarter in general, it made them better at monitoring their own thinking while doing something chess-like, and that skill did not travel very far past the domain it was trained in.

That study used an active control group of its own — children who received extra math instruction instead of chess — and still found the chess group ahead on the meta-cognitive measure, which is a more convincing design than most of the literature behind it. It is also a good example of what a believable transfer claim looks like: specific, modest, and tied to a plausible shared mechanism, rather than a blanket “chess makes children smarter.”

  • Real, and well supported. Chess makes you better at chess, and rating gains track practice hours closely.
  • Plausible, and modest. A year or more of regular instruction may help planning-heavy schoolwork a little, mainly math.
  • Not well supported once studies control for novelty. A durable boost to general intelligence.

So should you play chess for a smarter brain

If the goal is a higher IQ score, the honest answer is that chess is not a reliable way to get one, and probably no single hobby is; see how much of IQ is fixed versus changeable for the wider picture and what the evidence says actually moves the number. If the goal is a genuinely absorbing game that rewards planning, pattern recognition and calm decision-making under pressure, none of the transfer research changes that case at all — it only argues against expecting it to do something else on the side.

The more general lesson travels well beyond chess. Any claim that a specific game, app or hobby raises IQ deserves the same two questions asked here: what did the comparison group do, and how much of the reported effect survives once that comparison is fair? Retesting itself raises scores for reasons that have nothing to do with getting smarter, which is one more way an easy-looking result can mislead.

None of that is a reason to skip chess. It is a reason to want it for what it reliably gives you — a demanding, endlessly replayable game, not a training program with a guaranteed side effect on a test score you will take somewhere else entirely.

Share this article

Know someone who keeps seeing these numbers quoted without the scale they were measured on? Send it to them.

Tagged active control group, chess and iq, cognitive training, deliberate practice, far transfer, how to increase iq, Improving IQ Scores, intelligence test, IQ Science, nature vs nurture, near transfer, Practice Effect, publication bias, replication crisis

What an IQ of 85 Means

Scores & Scales

What Does an IQ of 85 Mean? The Low Average Band

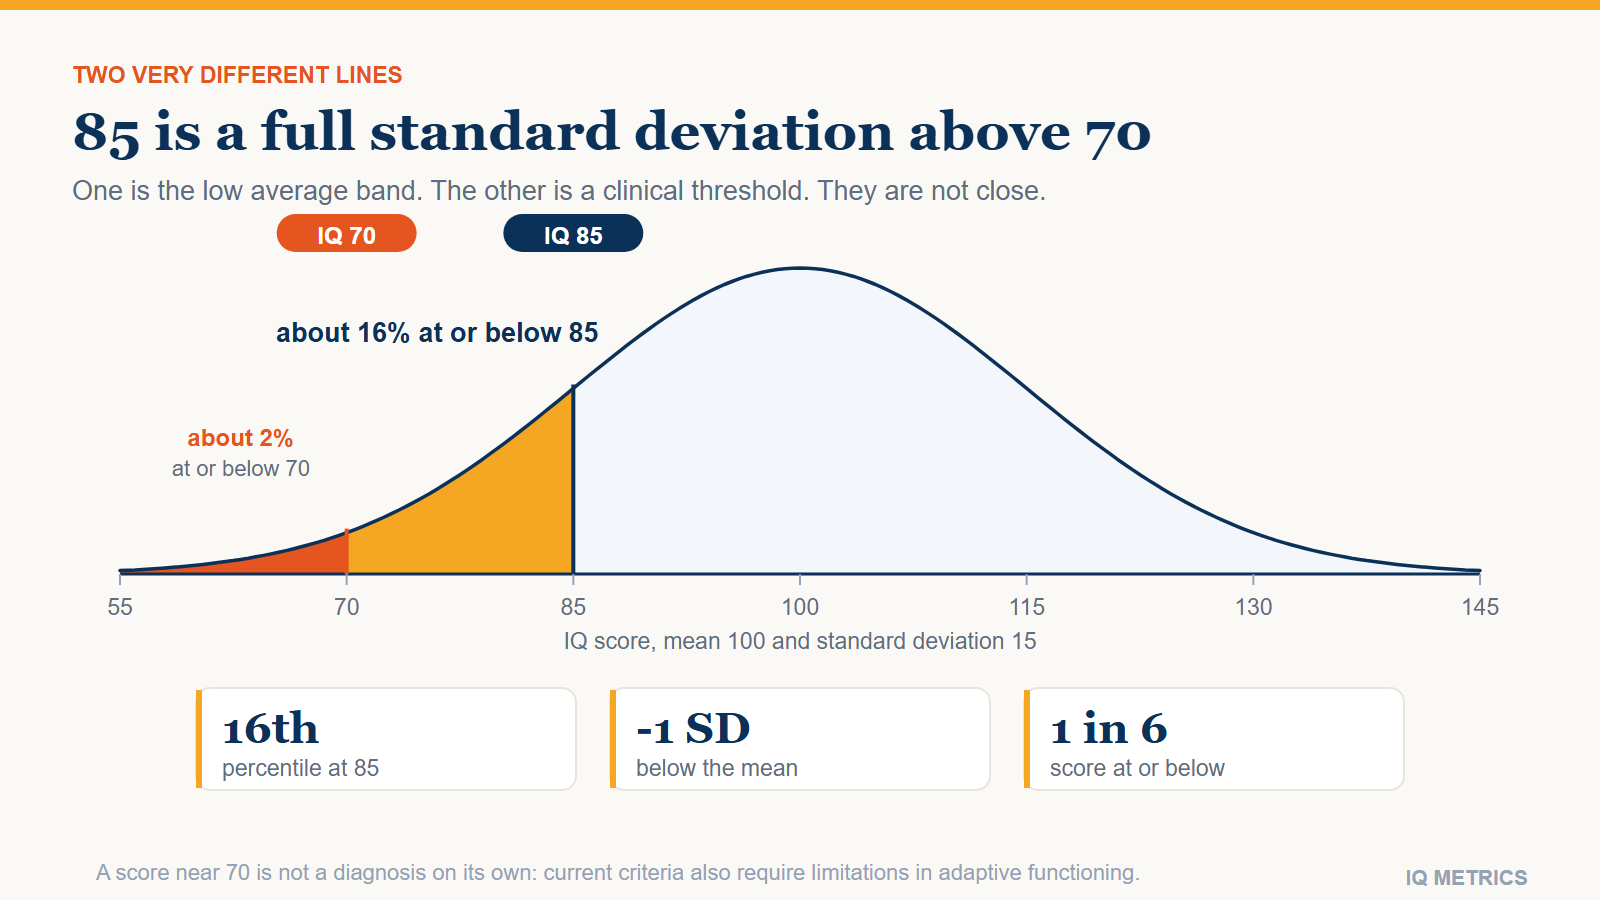
A score of 85 sits exactly one standard deviation below the population mean, at roughly the 16th percentile. It is the bottom edge of what test manuals call low average, it is well clear of any clinical threshold, and on its own it says considerably less about a person than the number appears to.

Bell curve of IQ scores with the region below 85 shaded and the separate threshold at 70 marked further to the left, showing about 16 percent at or below 85 against about 2 percent at or below 70

A score of 85 is one standard deviation below the population mean. On a test scaled to a mean of 100 and a standard deviation of 15, that places it at roughly the 16th percentile: about 16 people in every hundred score at or below it, and about 84 score above.

Test manuals call that band low average or below average, depending on the publisher. It is not a clinical category, it is not close to the threshold used for intellectual disability, and the distance between those two facts is the thing most people arrive here needing.

Where 85 sits, and how many people are there

IQ scores describe position, not quantity. A test is normed on a large representative sample; the middle of that sample is called 100 and one standard deviation is called 15 points. Everything after that is arithmetic on a normal curve.

  • About 16 percent of the reference population scores at or below 85.
  • That is roughly one person in six — four or five children in an average class of thirty.
  • The band from 80 to 89 is one of the most populated stretches of the whole scale.

The scale is symmetric, so 85 is exactly as far below the mean as 115 is above it, and about as common. The IQ percentile calculator will place any score against the same curve, and the IQ level chart shows the bands side by side.

Bell curve of IQ scores with the region below 85 shaded and the separate threshold at 70 marked further to the left, showing about 16 percent at or below 85 against about 2 percent at or below 70

85 is not the disability threshold, and the gap is large

This is the most common and most consequential confusion about a score in this range.

The diagnostic threshold associated with intellectual disability is approximately 70, two standard deviations below the mean, at about the 2nd percentile. Eighty-five is a full standard deviation clear of it. In percentile terms the difference is between roughly 16 percent of the population and roughly 2 percent — the two describe entirely different groups.

And the score alone does not carry the diagnosis in any case. Current criteria require significant limitations in adaptive functioning — conceptual, social and practical skills in daily life — alongside the cognitive finding, with onset in the developmental period. A number on its own is not sufficient, by design, precisely because a number on its own has been misused historically.

The label depends on the manual, and none of them is a verdict

There is no shared official vocabulary for score bands, and the names have changed as publishers have moved away from language that read as a judgment about people.

  • Current Wechsler editions print this range as Low Average, and the most recent revisions have moved further towards purely descriptive labels.
  • Stanford-Binet uses Low Average as well.
  • Older manuals from the early twentieth century used clinical terms that are now considered slurs, which is exactly why the vocabulary was replaced.

If a chart you have found online attaches an adjective harsher than “low average” to 85, it is not reporting a test manual. IQ classifications compares what the actual publishers print.

A full-scale 85 can hide a very uneven profile

The headline number is a composite. Underneath it sit index scores — typically verbal comprehension, perceptual or fluid reasoning, working memory and processing speed — and they do not have to agree with each other.

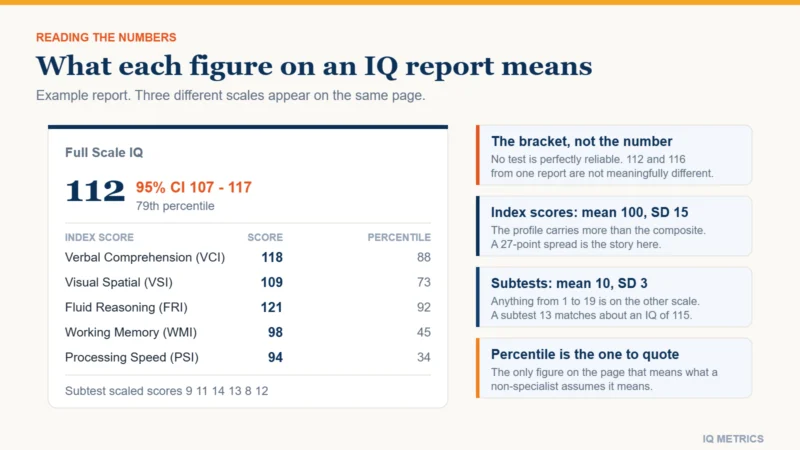
A full-scale 85 can be four flat indices near 85. It can equally be a verbal comprehension of 100 dragged down by a processing speed of 70. Those two profiles describe different people, suggest different support, and produce the same headline. Where the spread between indices is large, many clinicians treat the full-scale score as uninterpretable and read the indices instead.

This matters especially where a specific learning difficulty or an attention condition is in the picture, because those tend to depress particular indices rather than the whole profile. ADHD, autism, dyslexia and IQ test scores covers the characteristic patterns, and how to read an IQ test report shows where the scatter is printed.

Your own number

Where would your own score land?

Take the IIF-certified assessment and get your score with the scale it was measured on, the percentile it corresponds to and the confidence range around it — the three figures most online tests leave out.

Find your IQ score now! →

Secure & encryptedInstant results10–20 minutes

The error bar, and what it does and does not overlap

A professional full-scale score carries a 95 percent confidence interval of roughly plus or minus 4 to 5 points, so a measured 85 means “the true score is very probably between 80 and 90”. Online tests are wider, sometimes much wider.

Two things follow. First, 85 and 97 really are different results: their intervals do not overlap, so the test has genuinely distinguished them. Second, 85 and 88 have not been distinguished, and neither have 82 and 85. Small differences within the band are noise. The margin of error explained has the arithmetic.

What moves a score in this range, and what does not

Scores at the lower end are more sensitive to test conditions than scores in the middle, because unfamiliarity with testing costs more when the material is already hard.

  • Conditions on the day. Anxiety, poor sleep, an unfamiliar interface and time pressure all pull results down. See test anxiety and IQ scores.
  • Language and cultural distance from the norm sample. A verbal test administered in a second language measures the language as much as the reasoning. Cultural bias in IQ tests is about what that does to items, and stereotype threat about what the situation itself does.
  • Genuine environmental exposures. Childhood lead exposure is the best-established of these, with the steepest losses at the lowest doses. See lead exposure and IQ and nutrition and IQ, which is careful about the difference between correcting a deficiency and supplementing an adequate diet.
  • Format familiarity. A second sitting reliably scores higher, mostly through the practice effect, which is about knowing the format rather than about ability.

What does not move it: brain-training apps, which improve performance on the trained task and transfer poorly to anything else. Can you improve your IQ separates the claims that survive scrutiny from the ones that do not.

When a low score is a measurement problem, not a finding

Before a score in this band is taken at face value, it is worth asking whether the test measured what it was supposed to. A depressed result can be a property of the administration rather than of the person, and there are recognisable signs.

  • The test was in a second language. Verbal subtests then measure vocabulary in that language, and the full-scale score drops accordingly. Non-verbal and culture-fair instruments exist for exactly this case; the IQ tests hub sets out which measures which.
  • An untreated sensory or attention difficulty. Uncorrected hearing or vision, or an unmanaged attention condition, depresses timed subtests first and the composite after.
  • The sitting itself went badly. Illness, exhaustion, or a rushed unsupervised online attempt produce scores that are not reproducible on a better day.
  • The test had no published norms. A number with no norm table behind it is not a percentile, whatever the results page called it.

A professional assessment reports on validity explicitly and will say when a score should not be interpreted. A short online test cannot, which is the main reason the two are not interchangeable. IQ test accuracy sets out what separates them.

What an 85 is actually useful for

Very little as a headline, quite a lot as a starting point. The legitimate uses of a score in this band are practical and specific: establishing eligibility for accommodations, identifying which index is out of line with the others, and giving a baseline that a later assessment can be compared against.

What it is not useful for is prediction about one person. Ability scores correlate with school attainment at around 0.5, which leaves about three quarters of the variation to everything else, and at the level of an individual that residual is the whole story. There is no occupation or qualification that an 85 rules out, and the range of adult outcomes within any narrow band of scores is wide and heavily overlapping.

If the number came from a short online test, treat it as a rough estimate with a wide interval and check it against what to look for before trusting an online score. If it came from a full professional assessment, the report contains far more usable information than its first page, and the indices are where to look.

Share this article

Know someone who keeps seeing these numbers quoted without the scale they were measured on? Send it to them.

Tagged below average iq, confidence interval, full scale iq, Index Scores, intelligence test, iq 85, iq scale, IQ Score, iq test ranges, low average iq, Norm Group, percentile rank, standard deviation iq, Test Accommodations

Is 130 IQ a Genius Score?

Scores & Scales

Is 130 IQ a Genius Score? What the Number Really Marks

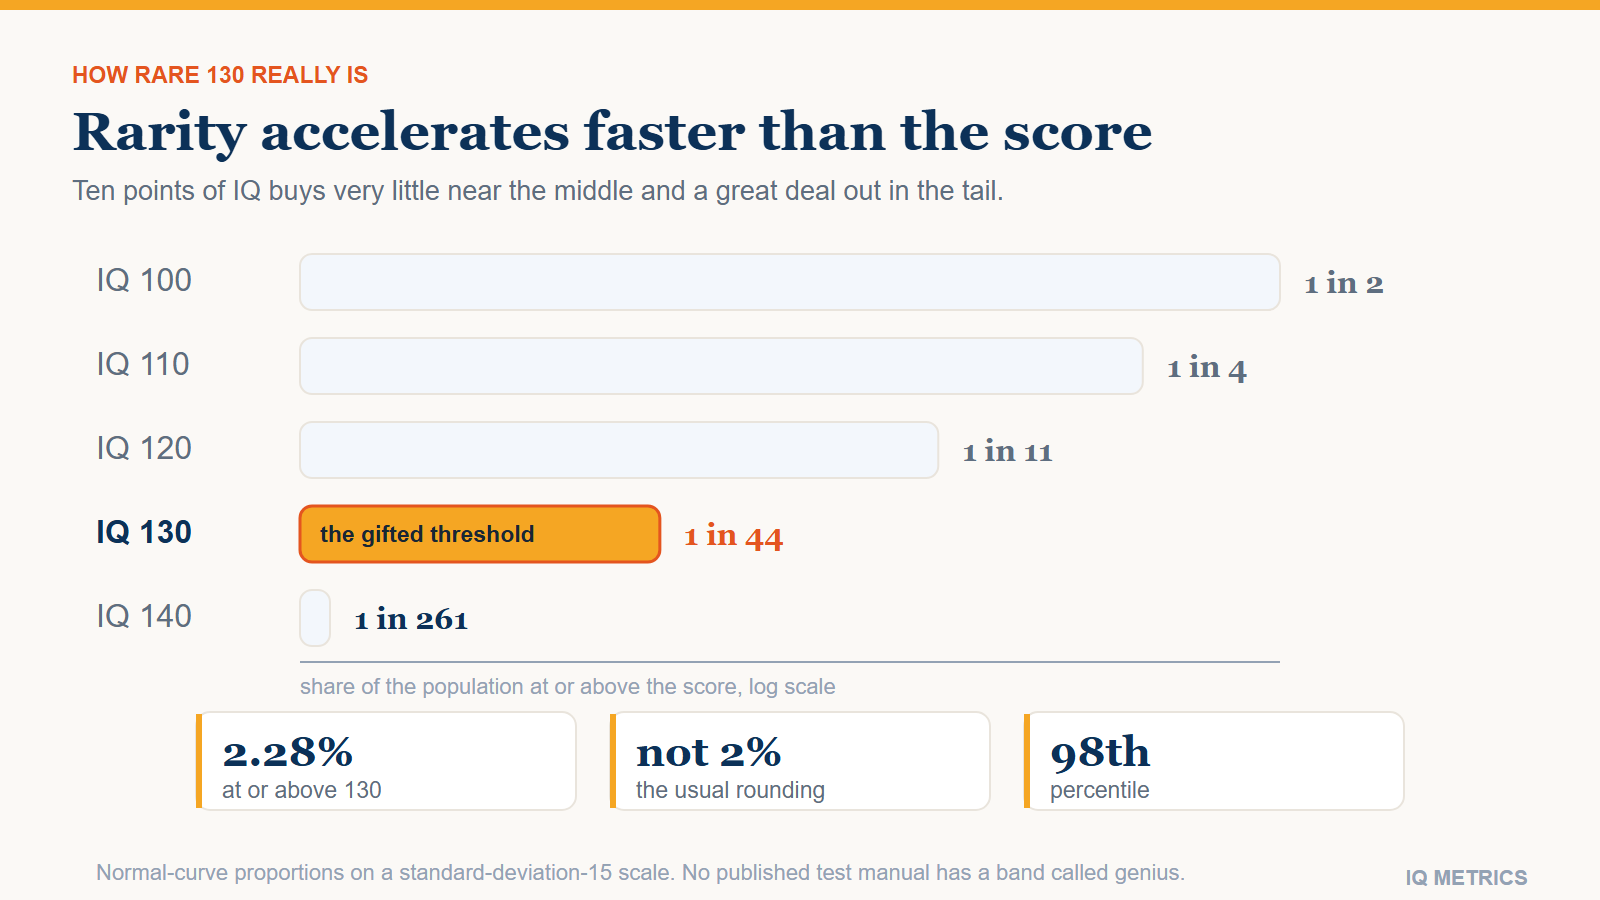
A score of 130 is the conventional threshold for gifted identification and for high-IQ society membership, and it is reached by about one person in 44. It is not, however, a "genius" score, because no published test defines such a band. The word is a popular import, and the difference is worth understanding.

Bar chart of how rare each IQ score is, showing 1 in 2 at 100, 1 in 11 at 120, 1 in 44 at 130 and 1 in 261 at 140, with the bars shortening far faster than the scores rise

Not exactly. A score of 130 marks the conventional threshold for gifted identification and for admission to most high-IQ societies. It sits two standard deviations above the mean, at roughly the 98th percentile, reached by about one person in 44.

What it is not is a “genius” score, and the reason is simpler than it sounds: no published intelligence test has a band called genius. Not the Wechsler scales, not Stanford-Binet, not any current professional instrument. The word arrives from popular writing and attaches itself to whatever number a chart happens to have handy.

What 130 actually marks on a test manual

IQ scores are positions in a distribution. The mean of the reference sample is defined as 100, one standard deviation as 15 points, and every score is a rank against that sample. Two standard deviations above the mean is 130, and that is where the top band on most manuals begins.

The names used for that band are publisher-specific:

  • Wechsler editions have printed it as Very Superior and, more recently, Extremely High.
  • Stanford-Binet uses Gifted or Very Advanced.
  • Education systems generally use gifted, and set the line at 130 or at a local equivalent.
  • No manual anywhere uses genius.

That last point is not pedantry. “Genius” in ordinary use means exceptional creative achievement — work that changed a field. That is an outcome observed over a career, not a percentile observed in an afternoon. Conflating the two is how the internet ended up with confident IQ figures for historical figures who never sat a test, a problem taken apart in where celebrity IQ numbers come from.

How rare 130 really is

The usual claim is “the top 2 percent”, which is close enough to be repeated everywhere and wrong enough to matter. On a normal curve, the proportion at or above two standard deviations is 2.28 percent — about 1 person in 44, not 1 in 50.

The gap widens as you go further out, because rarity accelerates much faster than the score does. Ten points of IQ near the middle of the curve moves a percentile by a few points; ten points near the tail changes rarity by an order of magnitude. How rare is an IQ of 130 works the numbers through, and the IQ bell curve page shows what each stretch of the curve actually contains.

Bar chart of how rare each IQ score is, showing 1 in 2 at 100, 1 in 11 at 120, 1 in 44 at 130 and 1 in 261 at 140, with the bars shortening far faster than the scores rise

130 on one scale is not 130 on another

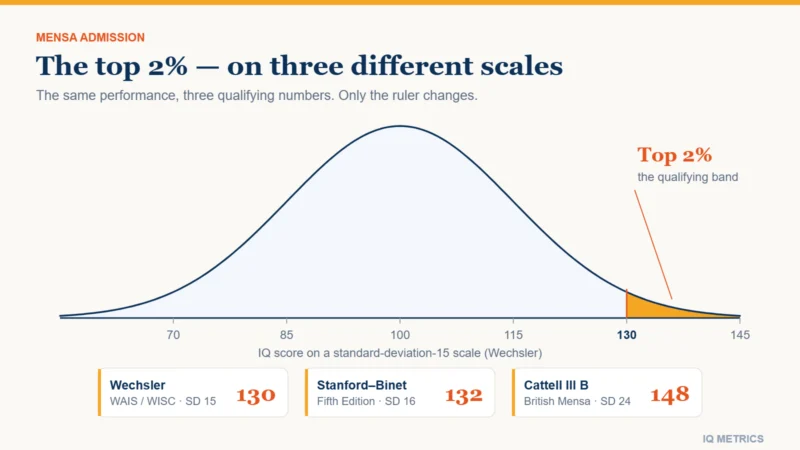
The 15-point standard deviation is a convention. Cattell’s scale uses 16, which is why Mensa publishes two qualifying numbers rather than one: 130 on a 15-point scale, 132 on a 16-point one. Both describe the same 98th percentile.

So a reported 130 means nothing until the scale is known, and a report that omits it cannot be compared with anything. Mensa IQ score requirements covers the accepted tests and the two thresholds, and the IQ score converter translates between scales directly.

The error bar straddles the line

A threshold implies a sharp edge. Measurement does not provide one.

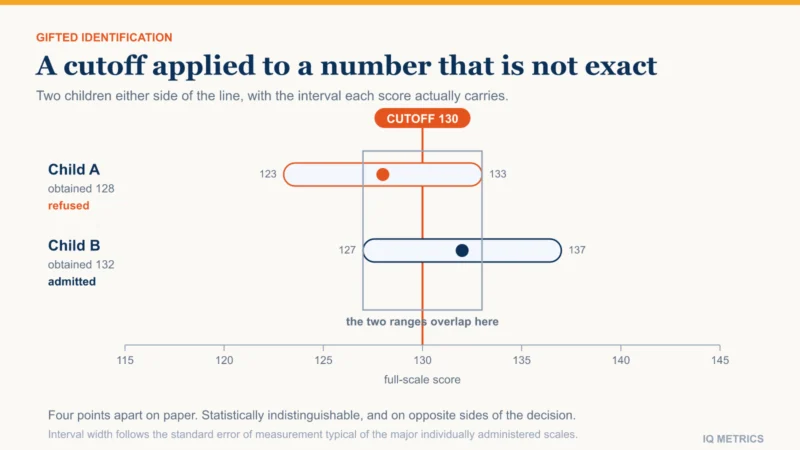
A professional full-scale score carries a 95 percent confidence interval of roughly plus or minus 4 to 5 points. A measured 130 therefore means “the true score is very probably between 125 and 135”, and a measured 127 means “very probably between 122 and 132” — two intervals that overlap heavily. The test has not separated those two people, but a cutoff at 130 does.

This is a real administrative problem rather than a philosophical one, and it is the subject of gifted cutoff scores: who a single number misses, why local norms sometimes replace national ones, and why universal screening changes who gets identified at all. The margin of error explained covers the underlying arithmetic.

Your own number

Where would your own score land?

Take the IIF-certified assessment and get your score with the scale it was measured on, the percentile it corresponds to and the confidence range around it — the three figures most online tests leave out.

Find your IQ score now! →

Secure & encryptedInstant results10–20 minutes

What 130 predicts, and what it does not

The relationships that hold at 120 hold at 130, with the same honest limits. Ability scores correlate with academic attainment at around 0.5, with job performance in complex roles more weakly than the older literature claimed, and with income mostly through education.

Two findings are specific to the high end and worth knowing:

  • The returns keep going, but they flatten. Above roughly 120 the incremental prediction of everyday outcomes weakens, though longitudinal work on very high scorers does still find differences in attainment, patents and doctorates at the top of the range. The effect is real and it is not a step change.
  • Creative achievement is not the same variable. The threshold hypothesis — that above a certain level of ability, creativity depends on other things — is contested in its strong form, but the weak version is well supported: past a point, personality, opportunity and sheer output matter more than additional points. IQ and creativity goes through the evidence.

So 130 predicts that abstract problems get solved faster than average. It does not predict originality, judgment or persistence, and it is not what distinguishes people who actually change a field. Why smart people make bad decisions is about the gap between the two.

What a high-IQ society actually asks for

If the question is really “does 130 get me in”, the answer depends on the society and, more importantly, on how the score was obtained.

  • The threshold is a percentile, not a number. Mensa asks for the 98th percentile, which is why it lists different qualifying scores for different tests rather than a single figure.
  • Supervised administration is required. No society accepts an unproctored online result, because the interval around one is far too wide and the conditions are unverifiable.
  • Prior evidence is often accepted. A qualifying score from a professionally administered test, sometimes taken years earlier, is usually enough without re-testing.
  • Other societies set higher lines. Some ask for the 99.9th percentile or beyond, where the norm tables are built on very small samples and the scores become correspondingly less reliable.

The full list of accepted tests and both qualifying numbers are in Mensa IQ score requirements, with the shorter version at the Mensa requirement explained.

A child scoring 130 and an adult scoring 130

The two are not the same claim, and conflating them causes real confusion for parents.

A child’s score is a comparison against other children of the same age, and it is considerably less stable than an adult’s. Scores measured in early childhood correlate only moderately with the same child’s scores a decade later; stability improves substantially from around school age and is high by adolescence. A 130 at five years old is a much weaker prediction than a 130 at fifteen. What age is most accurate for an IQ test goes into the detail, and the IQ scale by age explains how the age norming works.

For an adult, the score is stable in the sense that the ranking tends to hold, but the underlying abilities do not all move together over a lifetime. Reasoning speed declines from early adulthood while accumulated knowledge keeps rising, and a full-scale number averages over both. IQ and age has the curves.

What the word "genius" is actually doing

Historically it was a scoring label. Lewis Terman’s early Stanford-Binet used “genius or near genius” for scores above 140, and his longitudinal study of high scorers was informally called the Genetic Studies of Genius. The label did not survive contact with the results: the cohort did well, and produced no one whose work reshaped a discipline, while two future Nobel laureates had been screened out for scoring too low.

Test publishers dropped the word for good reasons, and it survives mainly in charts written by people who are not testing anyone. If the underlying question is about the top of the range rather than the vocabulary, what is genius IQ level and what is a genius IQ score cover the ground the term usually stands in for.

If you have a 130 in hand

The full-scale number is the least informative line on the report. A 130 built from four consistent index scores describes a different profile from a 130 built out of a 145 verbal score and a 108 processing speed, and the second is common enough that clinicians have a term for it. How to read an IQ test report shows where to find the index scores and the scatter between them.

And if the score came from a short online test, the interval around it is wide enough that the threshold question is genuinely open. High-IQ societies do not accept unproctored results for exactly that reason. Where a score sits relative to the curve is easy to check with the IQ percentile calculator; whether two scores actually differ is the harder question the IQ comparison tool is built for.

Share this article

Know someone who keeps seeing these numbers quoted without the scale they were measured on? Send it to them.

Tagged confidence interval, famous high iq, genius iq, gifted cutoff, high iq society, intelligence test, iq 130, iq scale, IQ Score, iq test ranges, mensa, Norm Group, percentile rank, standard deviation iq

Is 97 IQ Dumb?

Scores & Scales

Is 97 IQ Dumb? What a Score of 97 Actually Means

A score of 97 is average. It sits three points below the population mean, which is well inside the margin of error of any test that produced it, so 97 and 100 are the same result in every way that can be measured. The interesting question is not what 97 says about you, but how little any single number can say.

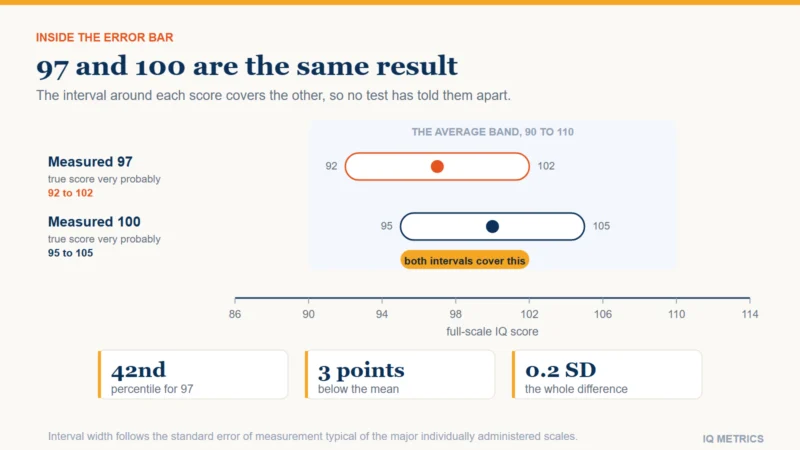
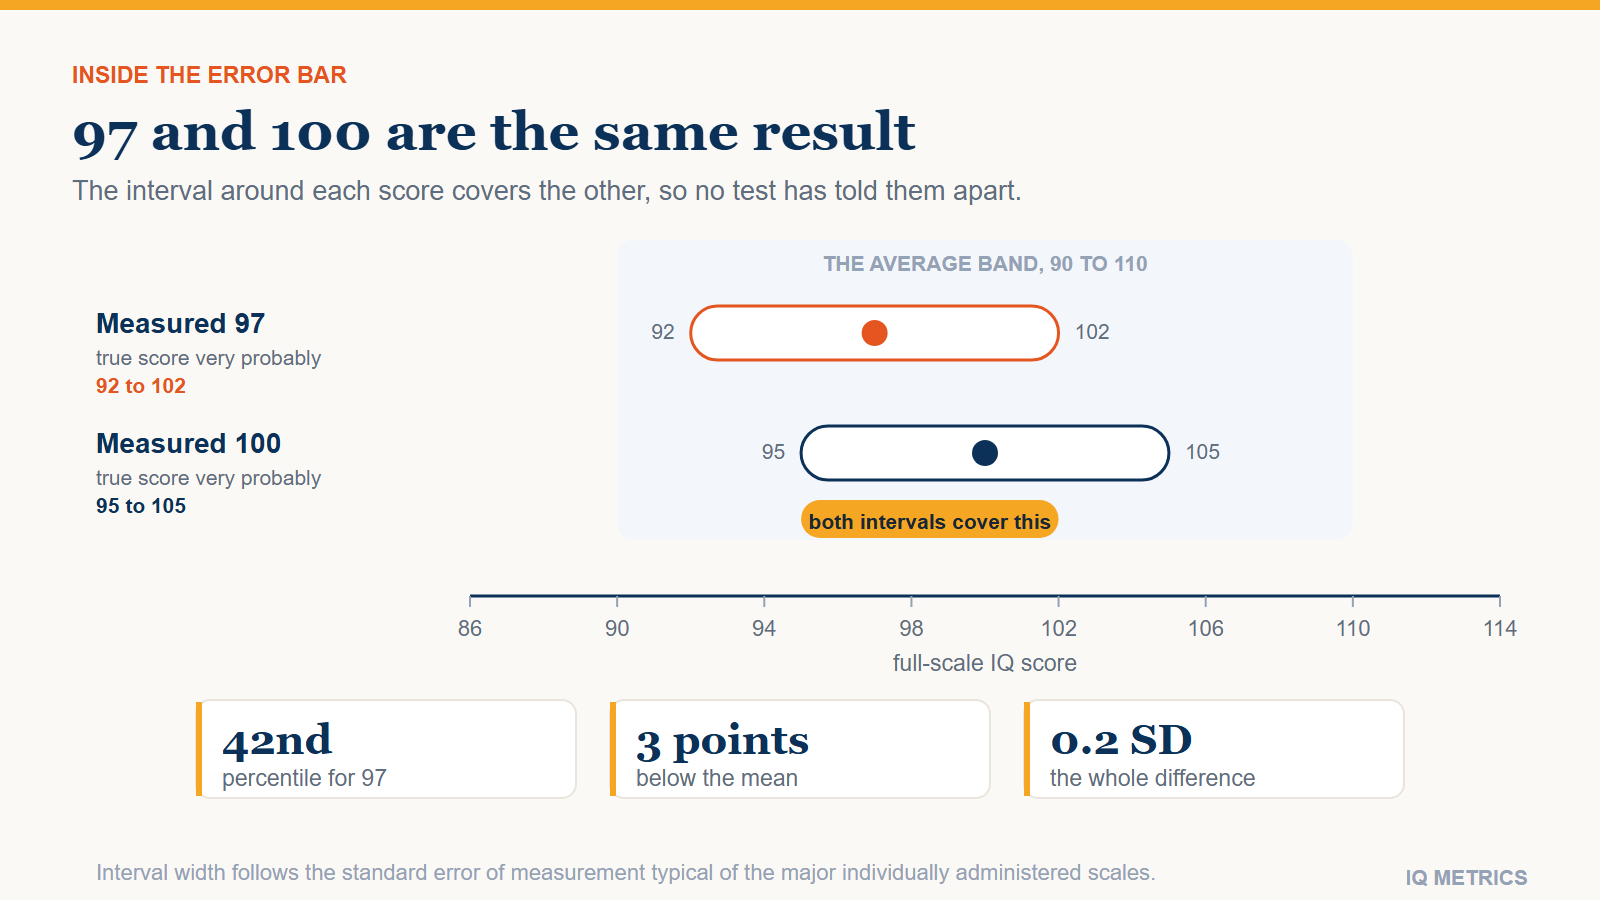
Two confidence intervals drawn on an IQ scale, one for a measured 97 and one for a measured 100, overlapping across almost their whole width to show that the two scores have not been told apart

No. A score of 97 is average. It sits three points below the population mean of 100, at roughly the 42nd percentile, which puts it inside the widest band on the entire scale — the one that contains about half of everybody.

More than that: 97 and 100 are not really different numbers. The measurement error on a full-scale IQ score is larger than the gap between them, so no test has actually distinguished the two. That is the part worth understanding, and it is what the rest of this article is about.

Where 97 actually sits

An IQ score is a rank, not a quantity. The test is given to a large representative sample, the middle of that sample is defined as 100, and one standard deviation is defined as 15 points. Every score is then a statement about position relative to that reference group and nothing else.

Three points below the mean is 0.2 standard deviations. On a normal curve that lands at about the 42nd percentile:

  • Roughly 42 percent of people score below 97.
  • Roughly 58 percent score at or above it.
  • Around half the population falls in the 90 to 110 band that contains it.

The band from 90 to 110 is not a category of person. It is the fat middle of a curve, and its width is the reason the label attached to it is simply “Average” in every published test manual. You can place any score against the same curve with the IQ percentile calculator.

Two confidence intervals drawn on an IQ scale, one for a measured 97 and one for a measured 100, overlapping across almost their whole width to show that the two scores have not been told apart

97 and 100 are the same score

This is the single most useful fact about a number like 97, and it is almost never printed next to it.

Every cognitive test reports with error. A well-built professional instrument carries a 95 percent confidence interval of about plus or minus 4 to 5 points on the full-scale score. Short online tests are considerably wider. So a measured 97 means something closer to “the true score is very probably between 92 and 102”.

That interval contains 100. It contains 99, 101 and 102. Which means the test has not established that the person who scored 97 differs from the population average at all — and it has certainly not established that they differ from someone who scored 101 on the same day. The margin of error explained works through the arithmetic, and how to read an IQ test report shows where the interval appears on a real score sheet.

Compare that with a score in a genuinely different band. A 85 has a confidence interval running roughly 80 to 90, which does not overlap 100 at all. That is a real distinction. A three-point gap is not.

Take the test again and the number will move

If the same person sits a comparable test a few weeks later, the score will change, and it will change for three reasons that have nothing to do with intelligence.

  • Measurement error. The same true ability produces a spread of observed scores. Movement of several points between sittings is expected, not a sign that something went wrong.
  • The practice effect. Second exposure to a cognitive test reliably raises the score, typically by several points on non-verbal material, and the gain is about familiarity with the format rather than ability. See the practice effect.
  • Regression to the mean. An unusually low or high result tends to be followed by one closer to the middle, purely as a statistical consequence of the first result being partly luck. Regression to the mean has the detail.

None of this makes tests useless. It makes a single number a poor summary of a person, which is a different complaint. Anything that affected the sitting itself — sleep, illness, anxiety, an unfamiliar format — also shows up in the score, and the factors that affect an IQ test result lists what is known to move it.

Your own number

Where would your own score land?

Take the IIF-certified assessment and get your score with the scale it was measured on, the percentile it corresponds to and the confidence range around it — the three figures most online tests leave out.

Find your IQ score now! →

Secure & encryptedInstant results10–20 minutes

What "average" describes and what it leaves out

The label “average” is a statement about a reference sample. It says the score sat near the middle of the group the test was normed on, at the time it was normed. It is not a statement about a person’s ceiling, their working life, or what they are capable of learning.

Three things it specifically leaves out:

  • The profile underneath. A full-scale 97 can be four flat index scores, or it can be a verbal comprehension of 115 against a processing speed of 80. Those describe very different people and produce the same headline number. Verbal versus non-verbal scores explains why the split matters more than the total.
  • Conditions on the day. Test anxiety, poor sleep and an unfamiliar interface all pull scores down, and their effect is largest for people who are least practised at testing. See test anxiety and IQ scores.
  • Everything the test does not sample. Motivation, conscientiousness, domain knowledge, social judgment and persistence are not on the test, and they carry real weight in outcomes. Is intelligence limited to IQ takes that seriously rather than as a consolation.

97 compared to what, exactly

Every IQ score is a comparison against a specific group of people tested at a specific time, and both halves of that sentence move the number.

The reference sample is usually national and stratified to match a census, so a score reported as 97 means “97 relative to this country’s population as sampled for this edition of this test”. Norm against a different group and the number changes without anything about the person changing. That is also why national average IQ comparisons are far weaker evidence than they are usually presented as.

Norms also expire. Raw performance on cognitive tests rose through most of the twentieth century, roughly three points a decade, so publishers periodically re-norm and the whole scale shifts back to a mean of 100. A person scoring 97 against 2010 norms would score differently against 1980 ones, on identical performance. The rise has stalled or reversed in several countries recently, which is its own story: why IQ norms expire.

The practical version of all this: a score is only as meaningful as the norm table behind it, and a test that does not publish one has not really produced a score at all.

What a 97 does not tell you about a life

Ability scores predict outcomes in the aggregate and predict individuals poorly. The correlation with school attainment is around 0.5, which sounds strong and means the score accounts for roughly a quarter of the variation. Three quarters of it sits elsewhere. At the level of one person, that residual is the whole story.

Concretely: within any band of a few points, the range of adult outcomes is enormous and overlapping. There is no attainment, occupation or qualification that a 97 excludes. There are thresholds set by other people — Mensa asks for the 98th percentile, some gifted programmes for 130 — but those are membership rules, not statements about capability.

If the number still bothers you

Two honest things can be said, and a third one cannot.

The first: the score you have is one estimate with a wide interval, and if it came from a short untimed quiz with no published norms, it is not really a measurement at all. What to check before trusting an online score is the list to run it against.

The second: what can be changed is real, but it is mostly about conditions and skills rather than the underlying ability. Familiarity with item formats, adequate sleep, and reducing anxiety all move measured scores. Correcting a genuine nutritional deficiency moves them; supplementing an already adequate diet does not. Can you improve your IQ is careful about which is which.

The third, which cannot honestly be said, is that the number does not matter at all. It measures something, and that something is related to how quickly unfamiliar abstract problems get solved under time pressure. It is simply a much smaller claim than the word “dumb” implies, and three points below a convention is not a finding about anyone.

Share this article

Know someone who keeps seeing these numbers quoted without the scale they were measured on? Send it to them.

Tagged average iq test score, confidence interval, full scale iq, intelligence test, iq 97, iq rating, iq scale, IQ Score, iq test ranges, Norm Group, percentile rank, Practice Effect, Regression to the Mean, standard deviation iq