IQ Metrics
IIF Certified Assessment Start IQ Test
IIF Certified Assessment

Digit Span Test

Scores & Scales

Digit Span Test: How It Works, Average Scores and What They Mean for IQ

A digit span test asks you to repeat lists of digits; on the WAIS it has three tasks of eight items. Verified adult averages run from 5.3 to 6.9 digits, not seven, and language matters: 8.84 in Mandarin versus 5.77 in English for the same people.

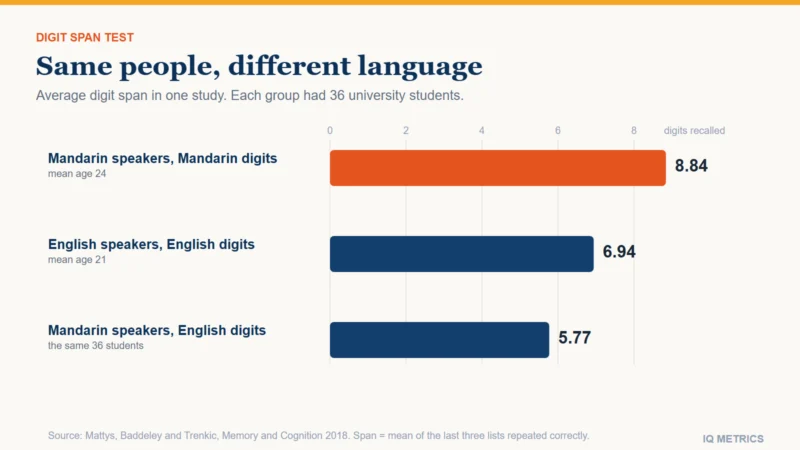
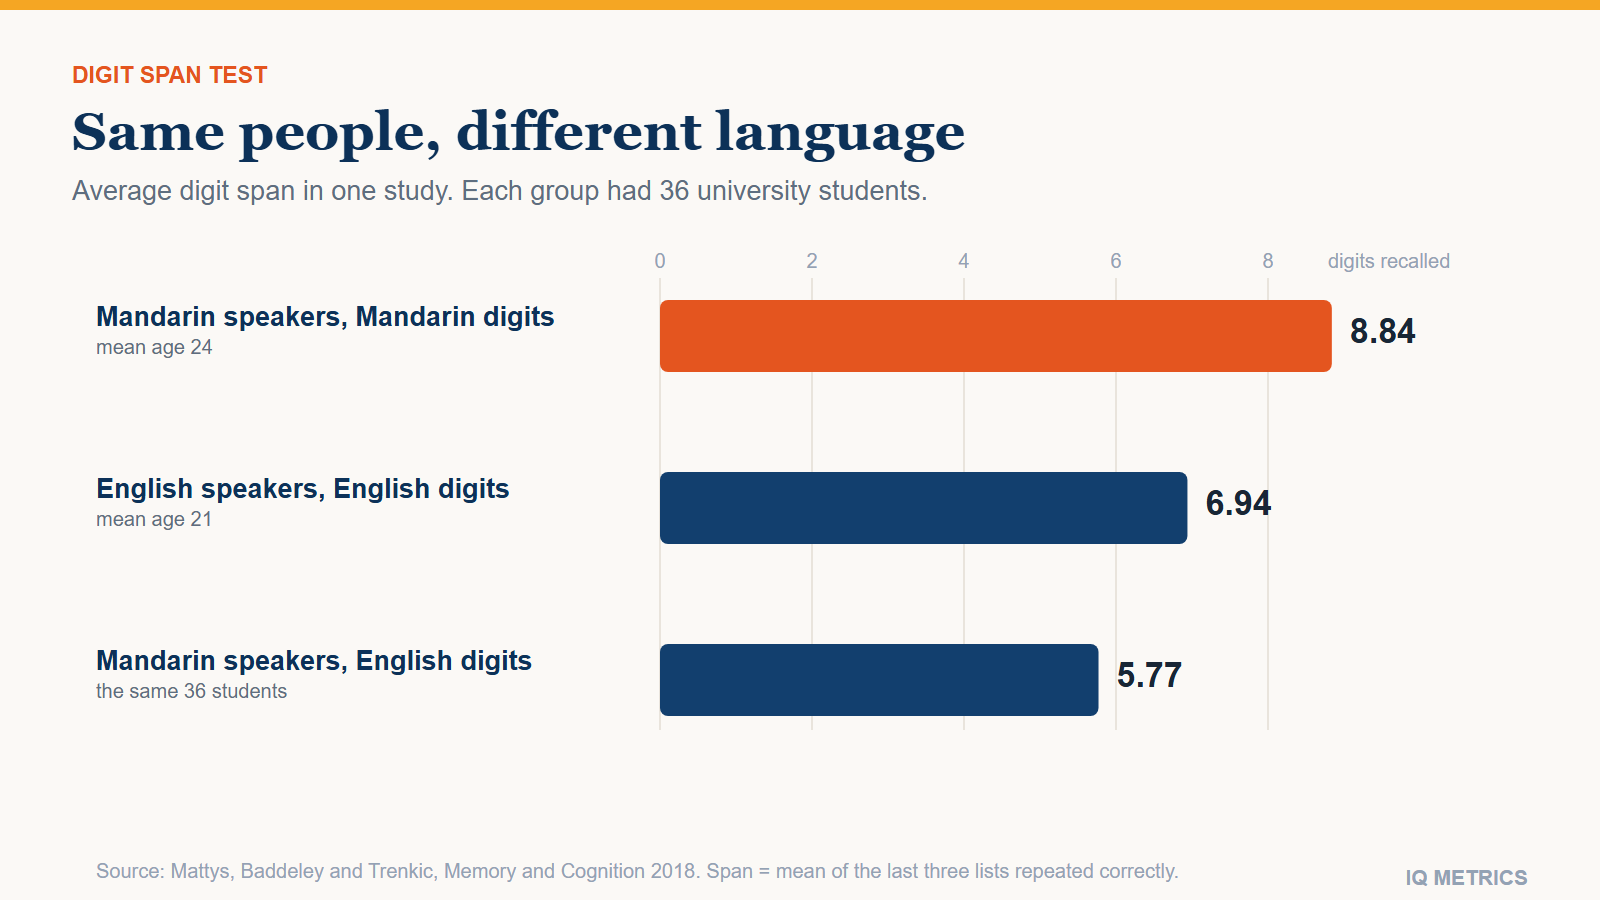
A bar chart shows average digit span in one University of York study. Native Mandarin speakers recalled 8.84 digits in Mandarin, native English speakers recalled 6.94 digits in English, and the same Mandarin speakers recalled 5.77 digits in English. Each group had 36 students.

A digit span test asks you to repeat lists of digits that get longer, and your span is the longest list you get right. On the Wechsler adult scales it has been three tasks, forward, backward and sequencing, each with eight items of two trials, stopping when both trials of an item are missed. There is no single average score. The adult means we could verify run from about 5.3 to 6.9 digits forward, depending on language and procedure, so the popular “seven” is only a rough rule of thumb, and the same Mandarin-speaking students recalled 8.84 digits in Mandarin but 5.77 in English. Digit span rises roughly in a straight line with intelligence in the WAIS-IV norm sample of 1,800, yet training it has not been shown to raise intelligence. This guide covers how the test works, how it is scored, what changed in the WAIS-5, average spans, the language effect, the link to IQ, online versions and training.

  • Forward: repeat the digits in the order you heard them. Backward and sequencing tasks also require you to manipulate the digits before answering.
  • WAIS-IV structure: three tasks of eight items, two trials per item, stopping after both trials of an item are missed; the longest span that can be scored is 9 digits forward and 8 backward.
  • WAIS-5: no subtest is called Digit Span any more. Digit Sequencing is a primary subtest in the Full Scale IQ, Digits Forward and Digits Backward are secondary, and Running Digits is new.
  • Average: verified adult means of 5.3 to 6.9 digits forward; the figure depends on the language and the procedure.
  • IQ: a mostly linear link with Full Scale IQ (Gignac and Weiss 2015); working-memory training shows no convincing far transfer (Melby-Lervåg et al. 2016).
A bar chart shows average digit span in one University of York study. Native Mandarin speakers recalled 8.84 digits in Mandarin, native English speakers recalled 6.94 digits in English, and the same Mandarin speakers recalled 5.77 digits in English. Each group had 36 students.

What is the digit span test?

An examiner reads a list of digits and you repeat it. On forward span you repeat the digits in the order heard. On backward span you say them in reverse, and the WAIS-IV includes a third, sequencing task. Researchers describe forward span as mainly short-term storage, while backward and sequencing demand active mental manipulation (Lintas et al. 2025). The task is old: Baddeley’s group notes that digit span was first developed by Jacobs in 1887. On the WAIS-IV it is presented by voice only, and a 2015 study of 226 patients referred for neuropsychological examination found the modality mattered, advising clinicians to “consider testing visual span as well before drawing conclusions about impaired WM from the WAIS-IV” (Egeland 2015). Because it is spoken, hearing matters; see our guide to hearing loss and test scores.

In the WAIS-IV, Digit Span is one of ten core subtests behind the Full Scale IQ and sits in the Working Memory Index with Arithmetic; our guide to WAIS-IV and WAIS-5 index scores explains how subtests roll up into index scores, and our WISC-V guide covers the children’s version. We do not reproduce test items here, because they are copyrighted.

How is the WAIS digit span scored?

  • Structure: forward, backward and sequencing each have eight items, and each item has two trials scored 0 or 1, so an item is worth 0, 1 or 2 points (Abdelhamid et al. 2021, describing an Arabic adaptation; a US record form shows the same two-trial structure).
  • Stopping rule: a task ends after scores of 0 on both trials of an item.
  • Two numbers per task: the total raw score, with a maximum of 16 for forward and 16 for backward, and the longest span, the number of digits on the last trial passed, which is at most 9 forward and 8 backward (from a WAIS-IV record form).
  • Conversion: raw scores become scaled scores with a mean of 10 and a standard deviation of 3, and index scores with a mean of 100 and a standard deviation of 15, through the publisher’s age-based norm tables. We could not verify the exact rule that combines the three tasks into one scaled score; the tables sit in the publisher’s manuals.

What changed in the WAIS-5?

The WAIS-5, published in 2024, no longer has a subtest called Digit Span. Pearson lists Digit Sequencing as a primary subtest that counts toward the Full Scale IQ, Digits Forward and Digits Backward as secondary subtests that do not, and a new Running Digits subtest, described as an auditory working-memory task “designed to measure registration and maintenance, including refreshing and updating information held in short term storage.” The primary Working Memory Index is now Digit Sequencing plus Running Digits, and Arithmetic is no longer part of it. A 2024 review sums up the changes: “one subtest was eliminated (Arithmetic), one was added (Running Digits), and one was substantially modified (Digit Span, now called Digit Sequencing)” (Winter, Trudel and Kaufman 2024). The Full Scale IQ is now a composite of seven subtests.

Pearson’s FAQ gives one worked example of how the norms read. At ages 16 to 17, a longest Digit Sequencing of four digits is at a cumulative percentage of 18.9, and eight digits at 96.1, where a cumulative percentage is “the percentage of examinees in the normative sample scoring below that score.” That is one age band on one task, not a table for every age.

What is the average digit span?

Not seven. George Miller’s 1956 paper “The Magical Number Seven, Plus or Minus Two” is the source of that idea, but Nelson Cowan’s 2001 reconsideration says Miller’s figure “was meant more as a rough estimate and a rhetorical device than as a real capacity limit,” and puts the limit at “about four chunks” when people cannot group items. Digits are easy to group, and the spans measured in real samples depend on the language, the pace and the scoring rule. These are the data points we could verify:

Verified average digit spans, by study
Group Procedure Forward Backward
36 native English speakers, University of York, mean age 21 Digits spoken 650 ms apart; span is the mean of the last three lists repeated correctly 6.94 (SD 1.03) not tested
36 native Mandarin speakers, same university, mean age 24 Same procedure, digits in Mandarin 8.84 (SD 1.30) not tested
The same Mandarin speakers, digits in English Same procedure 5.77 (SD 0.93) not tested
225 healthy Italian adults Computer, headphones, Italian digits 5.30 (SD 1.16; range 2 to 9) 4.54 (SD 1.23; range 1 to 9)

The first three rows are from Mattys, Baddeley and Trenkic (2018) and the last from Italian norms (Priftis et al. 2025). Neither is a Wechsler score, so they cannot be read straight against a scaled score. Two more findings put the numbers in context. In 784 healthy adults aged 60 to 90 in Seoul, tested on the WAIS-R digit span, education accounted for 29.8% of the variance in forward span and 28.3% in backward span, while age accounted for 1.1% and 0.6% (Choi et al. 2014). And backward spans are shorter than forward spans, by about 0.8 digit in the Italian sample.

We could not find an open table of average forward and backward spans by age band, for children or adults, and Wechsler’s norm tables are copyrighted. If a chart claims to give the normal digit span for a ten-year-old or a fifty-year-old without naming its sample, treat it as unverified.

Does language change your digit span?

Yes, and by a lot. In the York study, Mandarin speakers recalled 8.84 digits in Mandarin against 6.94 for English speakers in English (a difference of 1.62 standard deviations), and the same Mandarin speakers fell to 5.77 in English digits. Chinese digits were also spoken faster, at 6.44 syllables per second against 4.47 for English. The old explanation is that memory span depends on how many items you can rehearse aloud before the trace fades, so shorter names mean longer spans. The authors found it was not the whole story: single spoken digits lasted 417 ms in Chinese and 449 ms in English, a difference that was not significant, and they concluded that “speed of rehearsal did not provide an adequate account of differences between Mandarin and English spans.”

  • Welsh and English: in bilingual speakers, Welsh digits take longer to say and digit span is significantly smaller in Welsh; the authors argued that this word-length difference, “rather than intellectual differences,” explains why Welsh children’s digit-span norms were lower than American ones (Ellis and Hennelly 1980). A later study, as summarized by Mattys and colleagues, put the Welsh gap on coarticulation between words instead.
  • Four languages: across English, Spanish, Hebrew and Arabic, faster reading rates went with larger memory spans, tied to the number of syllables or phonemes per item (Naveh-Benjamin and Ayres 1986).
  • Children: in kindergarten to second grade, Chinese children remembered at least two more digits on average than American or Japanese children, with no Chinese advantage on backward span (Stigler et al. 1986, as summarized by Mattys and colleagues).
  • Older adults: a 2025 conference abstract covering 3,681 people aged 40 to 90 in 14 language cohorts found that, among cognitively normal people, forward and backward spans differed significantly between languages even after adjusting for age and education, and the best cut-offs for spotting Alzheimer’s differed by language (Tee et al. 2025).

The practical point is that a digit span is not a measure of memory that ignores language. A test given in a second language can understate the span, as the York Mandarin speakers show, and a single cut-off cannot serve every language. Our guides to second-language test scores and bilingualism and IQ cover the wider issue.

Your own number

Where would your own score land?

Take the IIF-certified assessment and get your score with the scale it was measured on, the percentile it corresponds to and the confidence range around it — the three figures most online tests leave out.

Find your IQ score now! →

Secure & encryptedInstant results10–20 minutes

Digit span and IQ: what the research says

Wechsler himself contended in 1958 that beyond an average span there was little benefit to a longer one. The WAIS-IV norm sample says otherwise. Gignac and Weiss analyzed 1,800 people aged 16 to 69 and found that all three longest-span scores “were found to exhibit primarily linear associations with FSIQ/g,” so “the commonly held position that Digit Span performance beyond an average level is not indicative of greater intellectual functioning was not supported” (Gignac and Weiss 2015). Every extra digit counts, on average, but one subtest is only one of ten (WAIS-IV) or seven (WAIS-5) inputs to the Full Scale IQ, so no chart converts a span into an IQ. No source we could open gives a reliable span-to-IQ conversion, whatever a search for “digit span iq” or “reverse digit span iq” turns up.

Forward and backward span are related but different. In a national sample of 1,342 children aged 5 to 19, Reynolds found the two processes distinct enough that they “should not be combined for clinical interpretation” (Reynolds 1997). The common belief that backward span is the more sensitive test is not supported either: in WAIS-III and WMS-III data, the backward conditions “did not appear more affected by risk factors such as aging or pathology than the forward scores” (Wilde et al. 2004). Our guides to working memory and reasoning and memory and IQ explain why remembering things and reasoning about them are different abilities.

What does a low digit span mean?

On its own, not much. Baddeley’s group notes that low digit span has been found in children with delayed reading and with slow vocabulary learning, and that it predicts difficulty learning a second language, so it is a useful clue in a full evaluation, for example alongside the working-memory profile described in our dyslexia and IQ guide. It is not a diagnosis. The score also depends on language, education, hearing, attention and the mode of presentation, as this guide has shown.

Digit span online and at home

Online digit span tests vary: some show the digits on screen, some play them, and each chooses its own pace and scoring. That matters because a Wechsler score is a total of trial points with a longest-span record, while the York study averaged the last three correct lists; a visual test also taps a different route than the spoken WAIS test (Egeland 2015). None of them is normed the way a Wechsler subtest is, and we could not verify any published average for the popular online number-memory tests, so treat a “level” on a website as an entertaining benchmark, not a norm. For an informal try with a friend, keep the pace steady at about one digit a second (the rate used in a large WAIS-R-based study of older adults) and stop when two tries at one length fail. Our guide to taking an official IQ test explains what a supervised evaluation involves.

Can you improve your digit span?

You can improve the skill, dramatically, with a method. In a 1980 Science paper, one subject raised his memory span “from 7 to 79 digits” after “more than 230 hours of practice in the laboratory,” and the authors concluded that with an appropriate mnemonic system there is “seemingly no limit to memory performance with practice” (Ericsson, Chase and Faloon 1980). What does not follow is that intelligence rises. A meta-analysis of 87 publications and 145 comparisons found “no convincing evidence of any reliable improvements” in nonverbal ability, verbal ability, word decoding, reading comprehension or arithmetic when working-memory training was compared with a treated control (Melby-Lervåg, Redick and Hulme 2016). See our guides to brain training apps and the memory athletes study. Some trials of supplements have also used backward digit span as an outcome; see our news guide to creatine and IQ.

Quick answers

  • What is a good digit span? Most healthy adults fall between about 5 and 7 digits forward in the studies we could verify, and less backward; the range depends on language and procedure.
  • What is the average digit span? Not a single number: 6.94 for English speakers in a York study, 5.30 for Italian adults in a computer test, 8.84 for Mandarin speakers in Mandarin.
  • How is the WAIS digit span scored? Eight items per task, two trials each, 0 or 1 point per trial, stopping after both trials of an item fail; raw scores convert to scaled scores with a mean of 10.
  • Does the WAIS-5 still have digit span? Its digit tasks continue as Digit Sequencing, Digits Forward, Digits Backward and Running Digits; the name Digit Span was retired.
  • Does digit span measure IQ? It is one input to IQ and relates to it roughly linearly, but a span cannot be converted into an IQ.
  • Is backward digit span harder or better? It is a different task, but not more sensitive to aging or pathology than forward span in WAIS-III and WMS-III data.
  • Can you train digit span? Yes, with mnemonics, but training has not been shown to raise intelligence.

The bottom line

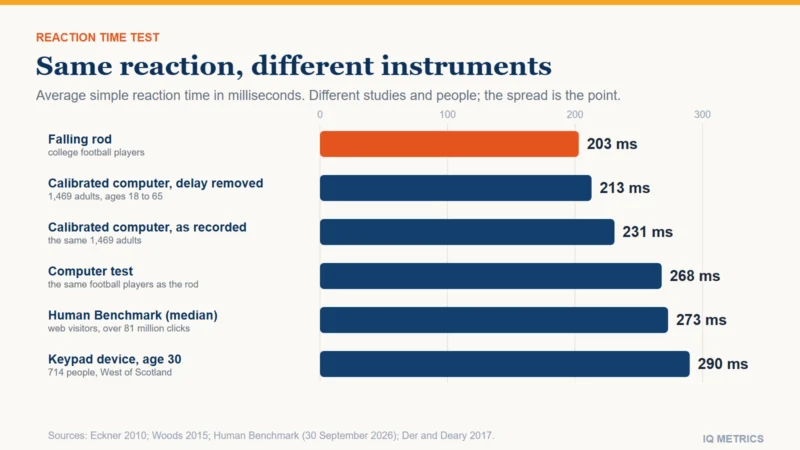
A digit span score is a short, spoken window on short-term storage and manipulation. It carries real information about working memory, it rises with intelligence across the whole range in the WAIS-IV norm sample, and it moves with language, education and the way it is presented. For a score you can interpret, you need the whole battery and the publisher’s norms; for curiosity, an online test is a fun benchmark against yourself. Reaction time is another simple speed measure that gets over-read; see our guide to reaction time test.

Sources

Share this article

Know someone who keeps seeing these numbers quoted without the scale they were measured on? Send it to them.

Tagged average digit span, average digit span by age, digit span backwards, digit span iq, digit span online, digit span test, digit span test score interpretation, forward and backward digit span, intelligence research, IQ Science, reverse digit span iq, wais digit span scoring, wais-5 digit sequencing, working memory test

Official IQ Test

Taking a Test

Official IQ Test: How to Take One, What It Costs and What You Get

There is no single official IQ test: official means a standardized test given by a qualified psychologist or a supervised exam such as Mensa’s. See how long it takes, what it costs (from $60 to $2,500), where to book one and what score you actually get.

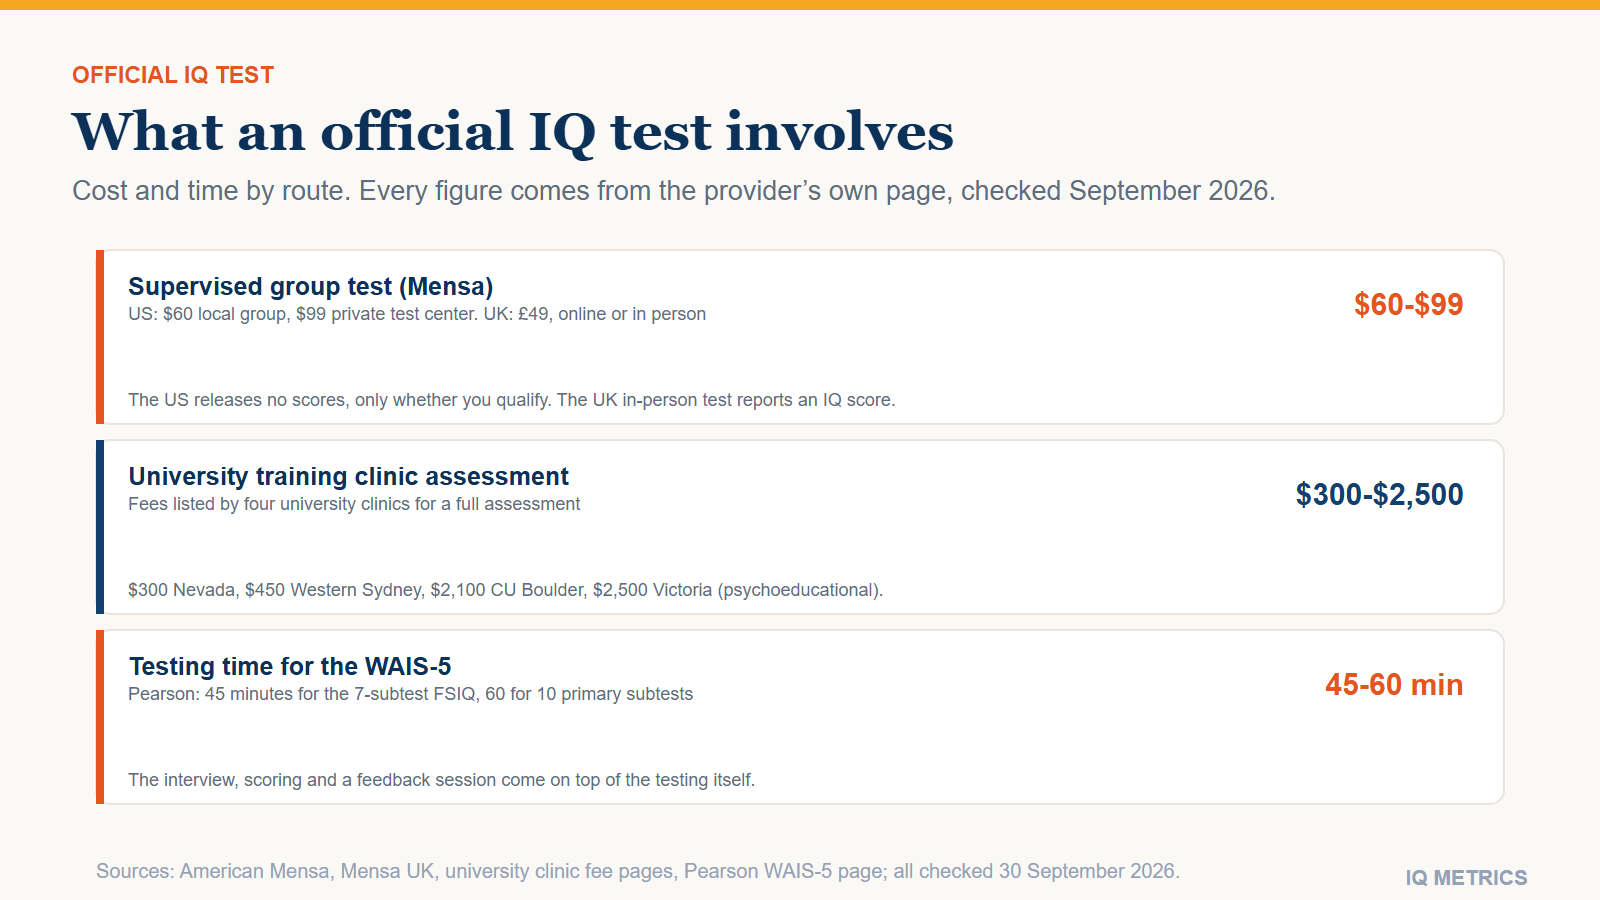
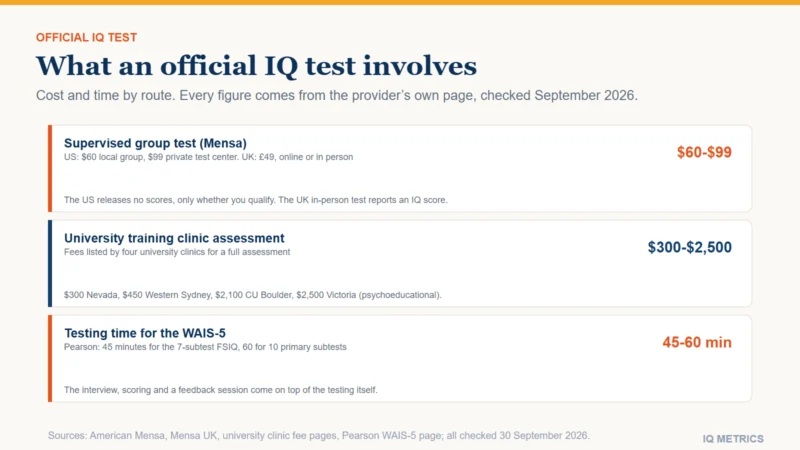
Three cards summarize an official IQ test. Supervised group test: American Mensa lists $60 for local group testing and $99 for private testing at approved testing facilities, and Mensa UK lists 49 pounds. University training clinic assessment: fees run from $300 at the University of Nevada, Reno to $2,500 at the University of Victoria. Testing time: Pearson lists 45 minutes for the seven-subtest WAIS-5 FSIQ and 60 minutes for the ten primary subtests.

There is no single official IQ test. In practice, “official” means a standardized intelligence test, such as the WAIS-5 for adults, given one-to-one by a qualified psychologist, or a supervised admission exam such as Mensa’s. Pearson lists 45 minutes of testing for the WAIS-5’s seven-subtest Full Scale IQ and 60 minutes for its ten primary subtests, and Mensa sessions run one to two and a quarter hours. On price, American Mensa charges $60 for local-group testing and $99 for private testing, Mensa UK charges £49, and the full assessments listed by four university clinics run from $300 to $2,500. This guide covers what counts as official, how long it takes, what it costs, where to book one, whether you can take one online and what score you actually receive.

  • What counts: a standardized test given one-to-one by a qualified professional, or a supervised exam such as Mensa’s. No single test holds the title.
  • Time: 45 to 60 minutes of testing for the WAIS-5 (Pearson); one to two hours for American Mensa; 1½ hours online and 2¼ hours in person for Mensa UK.
  • Cost: $60 (American Mensa, local group) to $99 (private testing); £49 (Mensa UK); $300 to $2,500 for full assessments at four university training clinics.
  • Who gives it: for a Wechsler scale, someone with Pearson “Level C” qualifications, such as a psychologist with a doctorate or a licensed practitioner with assessment training.
  • The score you get: a Full Scale IQ and index scores from a clinician. American Mensa releases no IQ score at all, Mensa Canada gives a percentile and Mensa UK reports an IQ score for its in-person test.
  • Online: Mensa UK’s online supervised test is proctored (£49); an unsupervised online quiz cannot be official.
Three cards summarize an official IQ test. Supervised group test: American Mensa lists $60 for local group testing and $99 for private testing at approved testing facilities, and Mensa UK lists 49 pounds. University training clinic assessment: fees run from $300 at the University of Nevada, Reno to $2,500 at the University of Victoria. Testing time: Pearson lists 45 minutes for the seven-subtest WAIS-5 FSIQ and 60 minutes for the ten primary subtests.

What counts as an official IQ test?

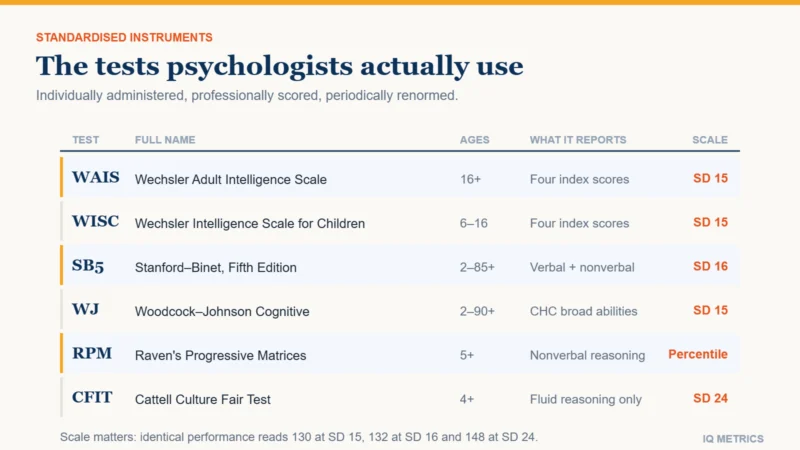
No test carries the title. What people mean is a test with three features: it is standardized against a large norm sample, it is given individually or under supervision by someone trained to do it, and its results come from a professional or an organization with the standing to stand behind them. The clinical batteries are the Wechsler scales, the Stanford-Binet, the Woodcock-Johnson cognitive battery and a handful of others, all compared in our guide to professional IQ tests. For adults the Wechsler choice is the WAIS-5 (published 2024, ages 16:0 to 90:11) or the older WAIS-IV, and for children the WISC-V or, for the youngest, the WPPSI-IV.

Publishers control who can use these tests. Pearson gives every product a qualification level, and the WAIS-5 is Level C, the highest. Its policy says Level C tests “require a high level of expertise in test interpretation” and can be purchased by people with a doctorate in psychology, education or a closely related field plus formal assessment training; or a license or certification to practice in a related field; or certification by, or full active membership in, a professional organization such as APA or NASP that requires assessment training and experience. A quiz website cannot license a Wechsler test, and a psychologist cannot skip the qualification.

Mensa uses the word differently. It runs its own supervised admission tests and also accepts evidence of a professional test. Mensa UK lists “a full educational psychologist’s report” and “documentary evidence of a professionally administered IQ test” as acceptable, and Mensa New Zealand accepts a score above the 98th percentile on any IQ test given in person by a registered psychologist, if its supervisory psychologist approves it. Our guides to Mensa score requirements and high-IQ societies cover the cut-offs.

How long does an official IQ test take?

Pearson lists 45 minutes of testing for the WAIS-5’s seven-subtest Full Scale IQ and 60 minutes for its ten primary subtests; the WAIS-IV took 60 to 90 minutes and the WISC-V takes about 60. American Mensa sessions run one to two hours, and Mensa UK’s take 1½ hours online or 2¼ hours in person. A full clinical evaluation is longer, because it adds an interview, other tests, scoring and a feedback session: one US university clinic quotes five to seven hours of testing over two visits. Our guide to how long an IQ test takes gives the time for every major test, how many questions to expect and why two people take different amounts of time.

How much does an official IQ test cost?

The price depends on what you buy: a pass-or-fail admission exam, or a full clinical assessment with an interview, several tests, a written report and a feedback session. The prices below were read from each provider’s own page on 30 September 2026, and promotions change often.

Prices listed by providers, 30 September 2026
Route Listed price What the page says it covers
American Mensa, local group testing (US) $60 A supervised session of “between one to two hours”; no scores released
American Mensa, private testing (US) $99 Sessions at “more than 400 approved testing facilities nationwide”; “exam administered electronically”; results “in days”
Mensa UK, Home Test £15 A 45-minute assessment taken at home; you receive an “indicative score”
Mensa UK, online or in-person supervised test £49 Proctored online (1½ hours) or in person (2¼ hours); the in-person page says you receive your IQ score
University of Nevada, Reno, Psychological Services Center (US) $300 ($150 for students) “Psychodiagnostic Assessment,” a training-clinic fee
Western Sydney University psychology clinic (Australia) $450 ($250 concession) “Interview, test administration, written report and feedback session”
CU Boulder, CU PATH clinic (US) $2,100 “Comprehensive adult evaluation”; $200 deposit; no insurance accepted
University of Victoria Psychology Clinic (Canada) $2,500 or $3,500 Psychoeducational assessment or neuropsychological assessment; sliding scale available

Two cautions apply. First, the clinic lines are prices for whole assessments, of which an IQ test is one part; none of these four pages lists an IQ-only fee, and psychologists in private practice price it in their own way. Second, CU Boulder says its fee is “lower than what psychologists typically charge in the community,” so a training-clinic price is closer to a floor than to an average.

Does insurance cover an IQ test?

Usually not when the reason is curiosity, education or membership. Aetna’s clinical policy on psychological and neuropsychological testing (last reviewed 20 March 2026) says testing “for educational reasons is not covered,” adding: “This testing is usually provided by school systems under applicable state and federal rules. Most benefit plans exclude coverage of educational testing.” It excludes testing “for employment, disability qualification, or legal/court-related purposes” too, while treating neuropsychological testing to assess cognitive impairment due to medical or psychiatric conditions as medically necessary when its criteria are met. Other insurers have their own policies, so check yours.

Can a school give a child an IQ test at no cost?

In the United States, sometimes. Under the federal special-education law (IDEA), a school district must evaluate a child it suspects has a disability. The regulation says the initial evaluation must be conducted “within 60 days of receiving parental consent,” or within the state’s own timeframe (34 CFR 300.301), and defines “public expense” as the agency either paying “the full cost of the evaluation” or ensuring it is “otherwise provided at no cost to the parent” (34 CFR 300.502, the independent-evaluation rule). The purpose is to decide whether a child has a disability and needs special education, so a school evaluation is not an on-demand IQ test, and scores from group gifted-program screeners such as the OLSAT are a separate matter. Our guide to IQ testing for children covers what children’s sessions involve.

Where can you take an official IQ test near you?

Start with the purpose. For a clinical evaluation, look for a licensed psychologist who lists cognitive or intellectual assessment, and ask which test and edition they use. National directories help: the American Psychological Association’s Psychologist Locator in the US, the British Psychological Society’s find-a-psychologist search in the UK and the Australian Psychological Society’s find-a-psychologist search. For a child, a school psychologist is the usual first contact. For a membership test, American Mensa asks for your ZIP code and lists sessions near you, and Mensa UK lists test centers and online bookings. Suggested searches such as “psychologist IQ test near me” and “Mensa IQ test near me” point to the two routes that can be official; an online quiz found through “IQ test near me” cannot be.

Before you book with a psychologist, ask:

  • Which test and edition? For adults, the WAIS-5 or the WAIS-IV, and whether you will get the Full Scale IQ and the index scores.
  • What does the fee include? The interview, the written report and a feedback session, or testing alone.
  • How long is testing, and how soon is the report? One session or two, and the turnaround.
  • Are they qualified for the test? Licensed, and eligible to buy and use it (Level C for Wechsler scales).
  • Paper, digital or remote? The WAIS-5 can be given on paper or on Pearson’s Q-interactive platform.

Can you take an official IQ test online?

Some, yes. Mensa UK’s online supervised test takes place in “a fully proctored, secure online environment.” American Mensa’s two options are local-group sessions and private sessions at “approved testing facilities,” the second with the exam “administered electronically.” On the clinical side, Pearson’s FAQ says the WAIS-5 Nonmotor Index “can be easily applied in remote testing situations” because “no manipulatives or response booklets are required,” and the publisher offers telepractice guidance. What cannot be official is an unsupervised online quiz: nobody verifies who took it, under what conditions or with what help. Our guides to online IQ test quality and IQ test accuracy explain what such a score can and cannot tell you. If you want a quick estimate of where you stand, the IQ Metrics test is an online estimate, not a clinical evaluation.

Your own number

Where would your own score land?

Take the IIF-certified assessment and get your score with the scale it was measured on, the percentile it corresponds to and the confidence range around it — the three figures most online tests leave out.

Find your IQ score now! →

Secure & encryptedInstant results10–20 minutes

What score do you actually get?

It depends on who ran the test. A clinician reports a Full Scale IQ, usually with a confidence interval and index scores, in a written report; see our guide to reading an IQ test report. Mensa works differently on purpose. American Mensa says its test “is given for the purpose of admission into Mensa and not to quantify intelligence,” that a qualifying score means you “tested at, or above, 98 percent of the general population,” and: “We are not able to provide a detailed report with scores, percentile ranks, or your IQ score,” citing Psychology Board of Texas regulations. Mensa Canada says an IQ score “per se, isn’t given but your percentile ranking is.” Mensa UK says of its in-person test: “you will receive your IQ score.”

The reason for percentiles is scale confusion. Mensa Canada quotes Mensa International: “The result on one test of 132 can be the same as a score 148 on another test.” That gap is the standard-deviation problem covered in our guide to SD 15 versus SD 16 and in Mensa score requirements. A single score also carries a margin of error; see IQ score margin of error.

Age limits, retests and waiting times

  • Minimum ages: Mensa UK tests candidates “over the age of 10 and a half”; American Mensa cannot test under 14 and encourages younger children to submit results from a clinical psychologist or their school; the WAIS-5 covers ages 16:0 to 90:11.
  • Retests: American Mensa says individuals “may take a test or test battery once every eight weeks.” Repeating the same test soon inflates a score through practice; see the practice effect.
  • Waiting: American Mensa lists private-testing results “in days”; Mensa Canada asks candidates to follow up after a month with no answer; clinic report times vary by practice, so ask when you book.

Quick answers

  • Is there an official IQ test? No single test holds the title. Official means a standardized test given by a qualified professional, or a supervised exam such as Mensa’s.
  • How long does an official IQ test take? Pearson lists 45 to 60 minutes of testing for the WAIS-5; Mensa sessions run one to two and a quarter hours; add the interview, scoring and feedback for a clinical evaluation.
  • How much does an IQ test cost? $60 to $99 for American Mensa, £49 for Mensa UK, and $300 to $2,500 for full assessments at four university clinics.
  • Can I take an official IQ test online? Yes, if it is proctored: Mensa UK’s online test is £49, while American Mensa’s $99 option is taken at an approved testing facility.
  • Does insurance pay? Aetna’s policy excludes testing for educational reasons; check your own plan.
  • Do I get an IQ score from Mensa? Not from American Mensa; Mensa Canada gives a percentile and Mensa UK reports an IQ score for its in-person test.
  • Where do I take one near me? Through a licensed psychologist (use a national directory), a school psychologist for a child, or a Mensa session.

The bottom line

“Official” is a matter of who runs the test and under what conditions, not of a brand name. If you want a diagnosis, an educational placement or a full profile, book a psychologist and expect thousands of dollars for a comprehensive assessment or a few hundred at a training clinic. If you only want to know whether you would qualify for a high-IQ society, a supervised Mensa session costs $60 to $99 in the US and £49 in the UK, and the answer may be a pass or a fail rather than a number. An online quiz can only be an estimate.

Sources

  • American Mensa: Take the Mensa Admission Test (fees, duration, score policy, retest rule), checked 30 September 2026.
  • Mensa UK: Test Yourself (Home Test, online and in-person supervised tests, prior evidence, age limit), checked 30 September 2026.
  • Mensa Canada: Frequently Asked Questions (percentile reporting, quoting Mensa International), checked 30 September 2026.
  • Mensa New Zealand: How to join (prior evidence from a registered psychologist).
  • Pearson: Wechsler Adult Intelligence Scale, Fifth Edition (WAIS-5): completion time, age range, qualification level and FAQ, checked 30 September 2026.
  • Pearson: Qualifications policy (Levels A, B and C).
  • University of Nevada, Reno: Psychological Services Center fees.
  • Western Sydney University: Psychology Clinics, about our services (psychometric assessment fees).
  • University of Colorado Boulder: CU PATH clinic, how much does an evaluation cost.
  • University of Victoria: Psychology Clinic fees.
  • Aetna: Clinical Policy Bulletin 0158, Neuropsychological and Psychological Testing (last review 20 March 2026).
  • 34 CFR 300.301: Initial evaluations (IDEA).
  • 34 CFR 300.502: Independent educational evaluation and the definition of public expense (IDEA).

Share this article

Know someone who keeps seeing these numbers quoted without the scale they were measured on? Send it to them.

Tagged how do i get an official iq test, how much does an iq test cost, intelligence research, IQ Science, iq test near me, iq test with insurance, is there an official iq test, mensa test cost, official iq test, online proctored iq test, professional iq test cost, psychologist iq test, wais-5 qualification level, where to take an official iq test

How Long Does an IQ Test Take?

Taking a Test

How Long Does an IQ Test Take? Test-by-Test Times, Questions and What Adds Hours

An official IQ test usually takes 45 to 90 minutes of testing: 45 for the WAIS-5, 60 to 90 for the WAIS-IV, 12 for the Wonderlic. See the time for every major test, how many questions to expect, why two people take different amounts of time and what a full evaluation adds.

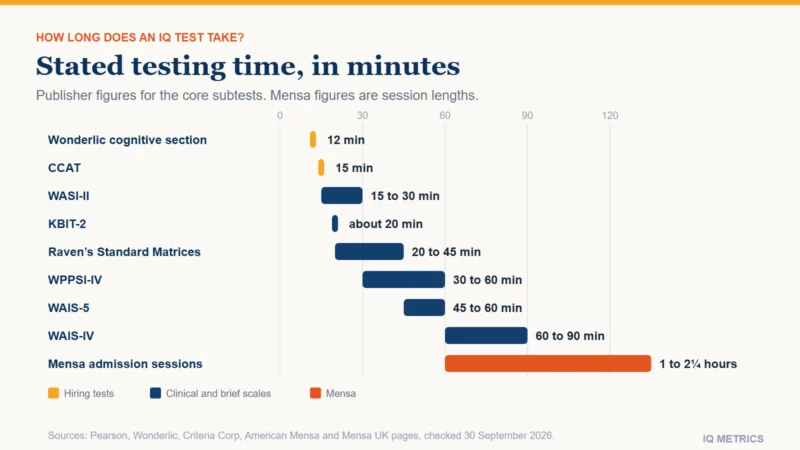
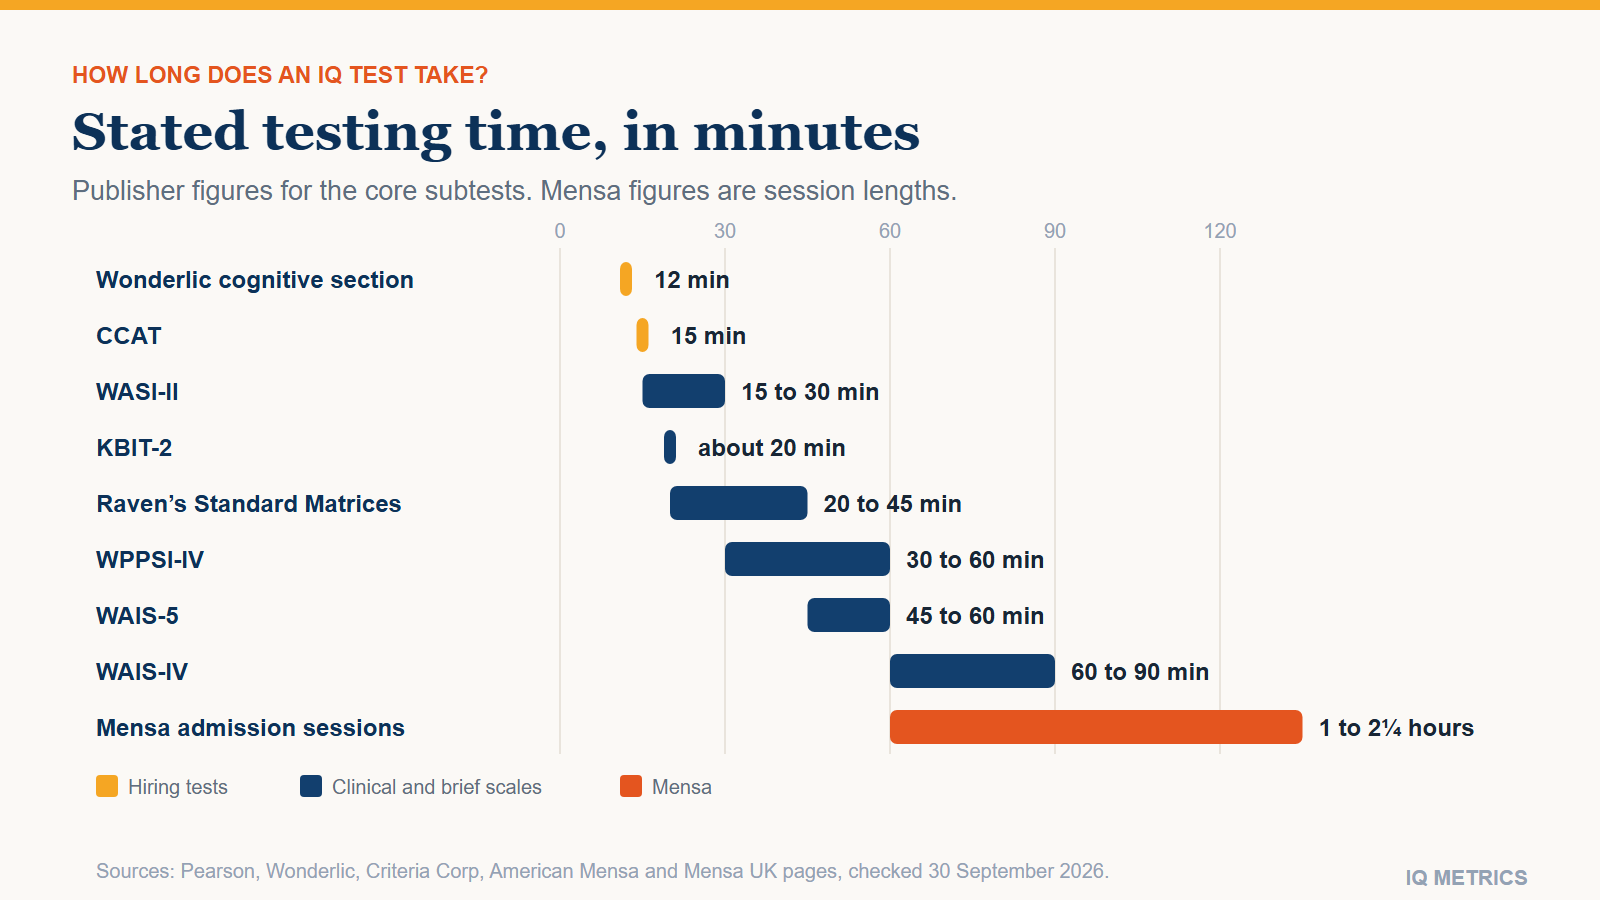
A chart of stated testing times in minutes. The WASI-II runs 15 to 30, the KBIT-2 about 20, the CCAT 15, the Wonderlic cognitive section 12, Raven's Standard Progressive Matrices 20 to 45, the WPPSI-IV 30 to 60, the WAIS-5 45 to 60, the WAIS-IV 60 to 90 and Mensa admission sessions 60 to 135 minutes.

How long does an IQ test take? An official IQ test usually takes about 45 to 90 minutes of testing, and a full evaluation takes several hours over one or two visits. Publisher-stated times for the core subtests are 45 minutes for the WAIS-5’s seven-subtest Full Scale IQ (60 for its ten primary subtests), 60 to 90 minutes for the WAIS-IV, about 60 for the WISC-V, 30 to 60 for the WPPSI-IV, about 20 for the KBIT-2 and 15 to 30 for the WASI-II. Mensa sessions run one to two and a quarter hours. Hiring tests are shorter: the Wonderlic cognitive section gives 50 questions in 12 minutes and the CCAT 50 in 15. This guide covers the time test by test, how many questions to expect, why two people take different amounts of time, what a full evaluation adds, whether a shorter test can do the same job, and whether the time of day matters.

  • Wechsler scales: WAIS-5 45 or 60 minutes (7 or 10 subtests), WAIS-IV 60 to 90, WISC-V about 60, WPPSI-IV 30 to 60 depending on age.
  • Brief tests: WASI-II 15 or 30 minutes, KBIT-2 about 20; Raven’s Standard Progressive Matrices has 60 items and is listed as untimed at 20 to 45 minutes.
  • Hiring tests: Wonderlic 50 questions in 12 minutes (the whole Select assessment takes about 35); CCAT 50 items in 15.
  • Mensa: one to two hours in the US; 1½ hours online or 2¼ hours in person in the UK.
  • A full evaluation: five to seven hours of testing over two visits plus a one-hour feedback meeting at one US university clinic, with the written report within about four weeks at another.
A chart of stated testing times in minutes. The WASI-II runs 15 to 30, the KBIT-2 about 20, the CCAT 15, the Wonderlic cognitive section 12, Raven's Standard Progressive Matrices 20 to 45, the WPPSI-IV 30 to 60, the WAIS-5 45 to 60, the WAIS-IV 60 to 90 and Mensa admission sessions 60 to 135 minutes.
A chart of stated testing times in minutes. The WASI-II runs 15 to 30, the KBIT-2 about 20, the CCAT 15, the Wonderlic cognitive section 12, Raven’s Standard Progressive Matrices 20 to 45, the WPPSI-IV 30 to 60, the WAIS-5 45 to 60, the WAIS-IV 60 to 90 and Mensa admission sessions 60 to 135 minutes.

How long does an IQ test take, test by test?

Publisher-stated testing times for the main instruments are in the table, with Mensa’s session lengths and two hiring tests for comparison. Pearson labels its figure “completion time” for the core subtests, and none of its pages says the figure includes the interview, breaks, scoring or the report.

Stated testing time, by test
Test Ages Stated time Source
WAIS-5 (2024) 16:0 to 90:11 45 minutes for the 7-subtest FSIQ; 60 minutes for the 10 primary subtests Pearson
WAIS-IV (2008) 16:0 to 90:11 60 to 90 minutes for the core subtests Pearson
WISC-V (2014) 6:0 to 16:11 About 60 minutes for the core subtests Pearson
WPPSI-IV (2012) 2:6 to 7:7 30 to 45 minutes (ages 2:6 to 3:11); 45 to 60 minutes (ages 4:0 to 7:7) Pearson
Stanford-Binet 5 2 to 85+ “Typical administration time is 5 minutes per subtest” Riverside
Differential Ability Scales II 2:6 to 17:11 Core battery 45 to 60 minutes; diagnostic subtests 30 minutes Pearson
KBIT-2 4:0 to 90:0 Approximately 20 minutes Pearson
WASI-II (2011) 6:0 to 90:11 30 minutes (four subtests); 15 minutes (two subtests) Pearson
Raven’s Standard Progressive Matrices 6:0 to 16:0; 17:0 and up 60 items; “Untimed” at 20 to 45 minutes Pearson
Raven’s Advanced Progressive Matrices 12:0 to 16:0; 17:0 and up “Untimed” at 40 to 60 minutes; the usual research procedure is 36 items in 40 minutes Pearson; Little et al. 2014
Wonderlic Select, cognitive section not stated 50 questions in 12 minutes; the whole assessment takes about 35 minutes Wonderlic
CCAT not stated 50 items in a 15-minute limit Criteria Corp
Mensa Norway online practice test norm bands from 16 35 puzzles in a 25-minute limit Mensa Norway
American Mensa admission test 14 and over “between one to two hours” American Mensa
Mensa UK Home Test / online supervised / in-person over 10½ for supervised 45 minutes / 1½ hours / 2¼ hours Mensa UK

Pearson says the WAIS-5 Full Scale IQ, which now needs seven subtests instead of ten, “can be obtained about 20 minutes faster than the WAIS-IV.” The Woodcock-Johnson publisher pages we could read give no total time, only the size of the batteries: 20 cognitive and 26 achievement tests in the WJ V (see our Woodcock-Johnson guide). Our guides to the Stanford-Binet, the WPPSI-IV and the WISC-V cover the children’s instruments.

How many questions are on an IQ test?

There is no single number. A Wechsler scale is a set of subtests, each with its own item list that stops after a run of misses, so nobody answers every item. Raven’s Standard Progressive Matrices has 60 items in five sets of 12; the Wonderlic and the CCAT each give 50 questions, and test takers are not expected to finish either in time (Criteria says fewer than 1% answer all 50 on the CCAT). Mensa does not publish item counts for its supervised tests, and Mensa International says it is “in the final stages of implementing computerised adaptive testing,” a format that “does not have a fixed set of test items.” The practice test on Mensa Norway’s site is 35 puzzles in 25 minutes, and its own page warns it is “not a substitute for professional intelligence tests.” For sample items and how the question types differ, see our guides to IQ test question types and Raven’s matrices, and the Wonderlic practice test and CCAT score guide.

Why two people take different amounts of time

Wechsler subtests start at an age- or ability-based item and stop after a run of misses, so the number of questions answered differs from person to person. Pearson’s WAIS-5 FAQ points out an irony of this: “Examinees who are intellectually gifted commonly require long testing times because they meet discontinue rules late in the item order or not at all.” The WAIS-5 therefore has special start points for examinees suspected of giftedness that “result in testing time reduction of approximately 25%.” Time limits also differ by task. In Pearson’s telepractice guide for the WAIS-5, Block Design, Visual Puzzles, Figure Weights, Arithmetic and Naming Speed Quantity carry item time limits, and Coding and Symbol Search a limit for the whole task, while Similarities, Vocabulary, Matrix Reasoning and the digit tasks have no strict limit. Speed still earns credit where it is measured: Pearson says removing the WISC-V Block Design time bonuses “would result in a loss of the ceiling, greatly reduced reliability, and a much lower correlation with general intelligence.” Our guides to WAIS-IV and WAIS-5 index scores and processing speed explain which subtests reward speed, and our digit span guide covers one of the untimed working-memory subtests. The Raven’s tests show the same trade-off: in an online experiment with 18 items, “20 min were sufficient for virtually all participants” when time was unrestricted, “whereas 10 min were sufficient for less than half” (Gonthier 2023).

How long does a full IQ evaluation take?

A clinical evaluation is much longer than the intelligence test inside it, because it usually adds other instruments. The University of Tennessee, Knoxville says a psychoeducational evaluation starts with a parent interview and testing that “typically lasts between three and four hours on the first day,” needs a second appointment, and totals “somewhere between five and seven hours” of testing, followed by a one-hour feedback meeting. The San Diego State University Psychology Clinic describes two to four appointments of a few hours each and says the written report “is generally provided within four weeks of your final assessment session.” Those are US clinics testing more than intelligence, so an IQ-only booking can be much shorter. One Australian clinic states that its fee “includes interview, test administration, written report and feedback session.” Our guide to taking an official IQ test covers what such an evaluation costs and where to book one.

Can a shorter IQ test do the same job?

Only roughly. In a clinical sample of 94 adults, Ryan and colleagues found that the WASI-II two-subtest IQ (about 15 minutes) correlated .96 with the four-subtest IQ (about 30 minutes) but overestimated it in 69.1% of cases, and only half of the two-subtest scores fell within 3 points of the four-subtest score. In a study of 198 people with Fragile X syndrome, the Stanford-Binet abbreviated score fell within one standard deviation (15 points) of the full-scale score at 77.2% of time points; the authors’ experience was that the routing subtests take 10 to 15 minutes against 60 to 90 for the full battery. A short test is a screen, not a substitute, which matters for the 10-minute quizzes online; see our guide to online IQ test quality and the timed IQ test page.

Your own number

Where would your own score land?

Take the IIF-certified assessment and get your score with the scale it was measured on, the percentile it corresponds to and the confidence range around it — the three figures most online tests leave out.

Find your IQ score now! →

Secure & encryptedInstant results10–20 minutes

Does the time of day matter?

A little, at least for school tests. A study of 2,034,964 test results from 570,376 Danish school children aged 8 to 15 found that, for every hour later in the day, performance fell by 0.9% of a standard deviation, while a 20 to 30 minute break raised it by 1.7% of a standard deviation (Sievertsen, Gino and Piovesan, 2016). Those were computer-based national school tests, not IQ tests, so the numbers are not IQ points, but they are a reason to ask for a break and a morning slot. A separate study of 198 high-school students aged 17 to 20 found a time-of-day match effect for a crystallized test but not for fluid reasoning on the Cattell Culture Fair Scale 3 (Jankowski, Díaz-Morales and Vollmer, 2023). See also our guides to sleep loss and test performance and how to prepare for an IQ test.

How long until you get the result?

It depends on who scores the test. An online test scores at once. American Mensa lists private-testing results “in days”; Mensa Canada asks candidates to follow up if they have heard nothing after a month; and one US clinic says its written report generally arrives within four weeks of the last session. In the US, a school district’s initial special-education evaluation must be conducted within 60 days of parental consent, or within the state’s own timeframe (34 CFR 300.301). How long a result stays useful is a separate matter; see our guide to how long an IQ test result is valid.

Quick answers

  • How long does an IQ test take? About 45 to 90 minutes of testing for a Wechsler scale, 15 to 20 minutes for a brief scale, and 12 to 15 minutes for a hiring test; a full evaluation takes several hours.
  • How long does an official IQ test take for adults? Pearson lists 45 minutes for the WAIS-5 seven-subtest Full Scale IQ and 60 for its ten primary subtests; the WAIS-IV took 60 to 90.
  • How long does an IQ test take for kids? About 60 minutes for the core WISC-V subtests and 30 to 60 for the WPPSI-IV, by age.
  • How long does the Mensa test take? One to two hours in the US; 1½ hours online or 2¼ hours in person in the UK.
  • How many questions are on an IQ test? No fixed number: Raven’s has 60 items, the Wonderlic and the CCAT 50, and Wechsler subtests stop after a run of misses.
  • How long does an online IQ test take? It varies: Mensa UK’s online workout is up to 15 minutes, Mensa Norway’s practice test 25 and Mensa UK’s Home Test 45. A short quiz is a screen, not a substitute for a full test.
  • Does a faster finish mean a higher IQ? No: on Wechsler scales high-ability examinees often take longer, and speed earns credit only on the timed subtests.

The bottom line

Plan on about an hour of testing for a Wechsler scale and an afternoon or two for a full evaluation, and on minutes rather than hours for a hiring test or a quiz. The publisher figures cover the core subtests only, so ask a psychologist what your booking includes and when the report will arrive. For what an evaluation costs, who can give it and what score you receive, read our guide to the official IQ test.

Sources

Share this article

Know someone who keeps seeing these numbers quoted without the scale they were measured on? Send it to them.

Tagged ccat time limit, how long does an iq test take, how long is the mensa test, how long is the wonderlic test, how many questions are on an iq test, intelligence research, IQ Science, iq test length, iq test time limit, ravens matrices time limit, short iq test accuracy, timed vs untimed iq test, wais-5 administration time, wisc-v administration time

Dyslexia and IQ

Understanding IQ

Dyslexia and IQ: Is There a Link? What the Research Shows

Dyslexia is a reading and spelling difficulty that occurs at every level of IQ, and the IQ-gap rule was dropped as a US requirement in 2004 and from the IDA definition in 2025. See what IQ tests show for readers with dyslexia, and what the genetics and myths add.

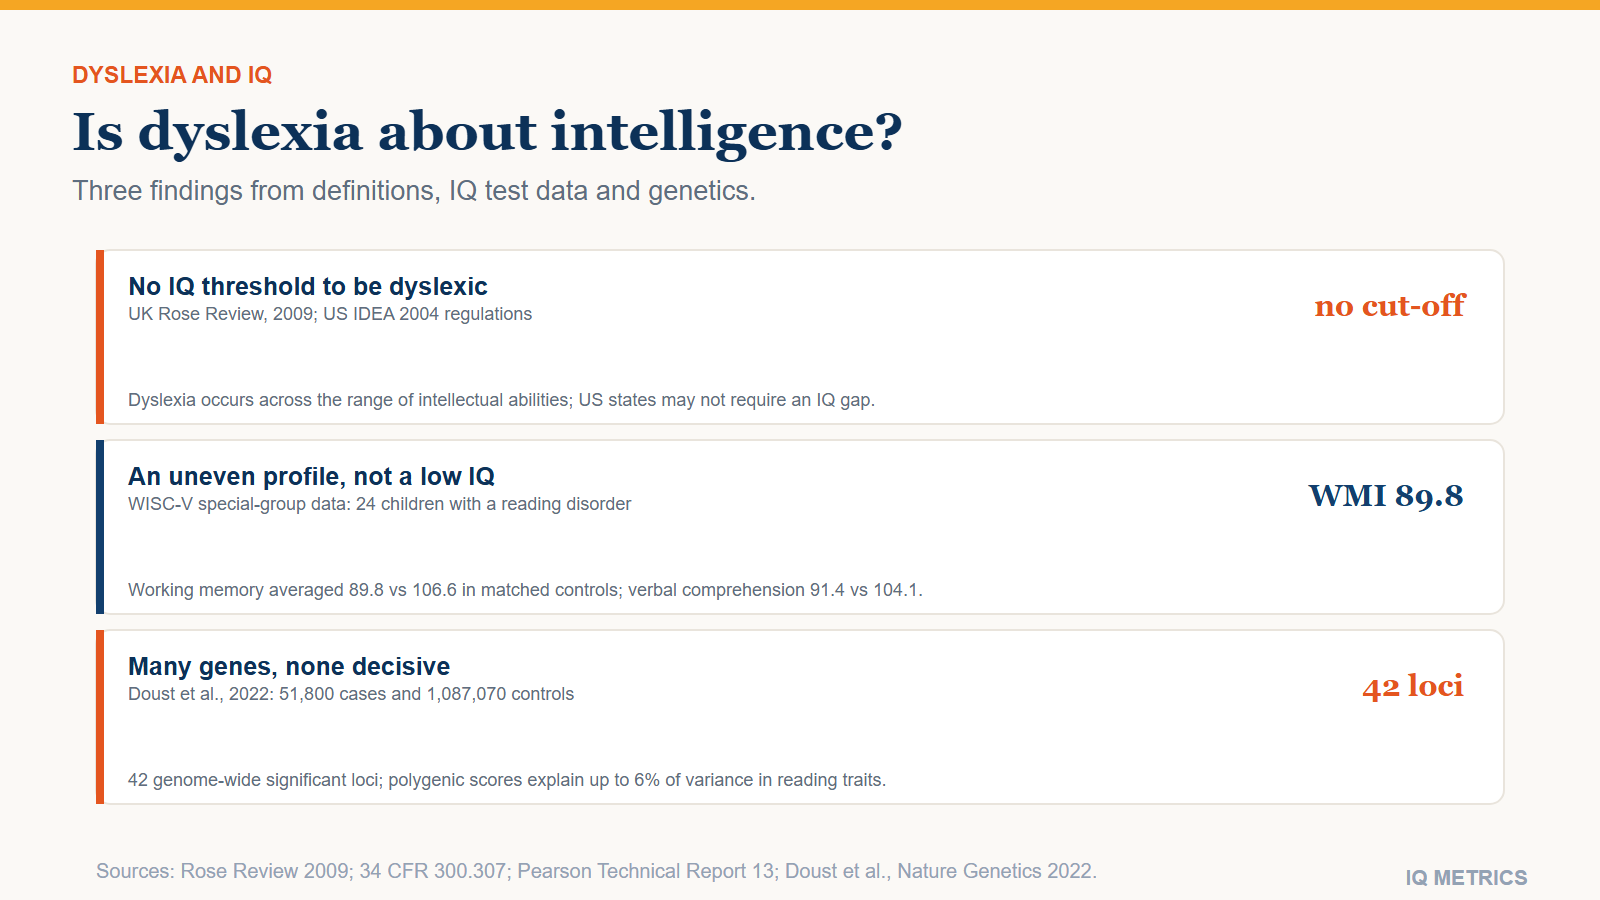
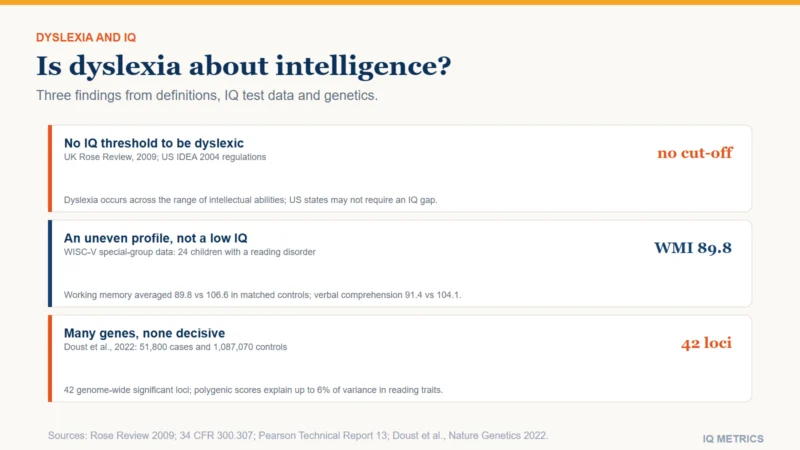
Three cards summarise dyslexia and IQ. No IQ threshold: the UK Rose Review says dyslexia occurs across the range of intellectual abilities, and US states may not require an IQ-reading gap. An uneven profile: in Pearson WISC-V data for 24 children with a reading disorder, working memory averaged 89.8 against 106.6 in matched controls. Genes: a 2022 study of 51,800 self-reported cases found 42 loci.

Dyslexia and IQ are separate things. Dyslexia is a difficulty with accurate, fluent word reading and spelling, not a measure of intelligence, and the UK Rose Review states that it “occurs across the range of intellectual abilities.” A person does not need a high, average or any particular IQ to be dyslexic. The old requirement for a gap between IQ and reading was dropped from US special-education rules in 2004, and in October 2025 the International Dyslexia Association replaced its 2002 definition, which had called the difficulty “unexpected” relative to other abilities. This guide covers what changed, what IQ tests show for readers with dyslexia, whether dyslexia lowers IQ scores, what genetics adds, and two popular myths.

  • Definition: difficulties with accurate and/or fluent word reading and spelling, on a continuum of severity, not a yes-or-no condition.
  • IQ needed? No. The UK Rose Review says dyslexia occurs across the range of intellectual abilities, and under US IDEA 2004 states “must not require” a severe IQ-achievement discrepancy.
  • Lower IQ? Not as such, but group profiles are uneven: in Pearson data for 24 children with a reading disorder, working memory averaged 89.8 and verbal comprehension 91.4, against 106.6 and 104.1 in matched controls.
  • How common? It depends on the cut-off: about 7% at 1.5 standard deviations below the mean, and roughly one in ten children in a 2022 genetics paper.
  • Genes: a 2022 study found 42 genome-wide significant loci; polygenic scores explained up to 6% of the variance in reading traits.
Three cards summarise dyslexia and IQ. No IQ threshold: the UK Rose Review says dyslexia occurs across the range of intellectual abilities, and US states may not require an IQ-reading gap. An uneven profile: in Pearson WISC-V data for 24 children with a reading disorder, working memory averaged 89.8 against 106.6 in matched controls. Genes: a 2022 study of 51,800 self-reported cases found 42 loci.

What is dyslexia, and what changed in 2025?

For two decades most articles quoted the International Dyslexia Association’s 2002 definition, which said the difficulty was “often unexpected in relation to other cognitive abilities and the provision of effective classroom instruction.” That is no longer the current wording. The IDA board adopted a revised definition on 22 October 2025, and the text no longer contains the word “unexpected.” The IDA page keeps the 2002 version only as a historical reference. In the UK, the British Dyslexia Association now presents a 2025 definition agreed by a panel of experts through the Delphi method, which accepted 42 statements. Neither new definition requires an IQ gap, though the UK wording still relates literacy to a person’s “other attainments.”

Dyslexia definitions compared
Source and year What it says
International Dyslexia Association, 2002 A neurobiological learning disability with accurate and/or fluent word recognition problems that are “often unexpected in relation to other cognitive abilities”
International Dyslexia Association, 22 October 2025 Difficulties in word reading and/or spelling involving accuracy, speed or both; a continuum of severity; difficulties persist even with instruction that is effective for peers. Phonological and morphological difficulties are “common but not universal.” No mention of unexpectedness.
Rose Review, UK, 2009 “A learning difficulty that primarily affects the skills involved in accurate and fluent word reading and spelling”; occurs across the range of intellectual abilities; a continuum with no clear cut-off points
British Dyslexia Association, 2025 Delphi definition “A set of processing difficulties that affect the acquisition of reading and spelling,” with literacy weak in relation to age, teaching and other attainments
DSM-5, 2013 Specific learning disorder with impairment in reading; academic skills well below the average range on appropriate tests; not better explained by other disorders. Dyslexia stays in the descriptive text.

The debate is still live. Snowling, Hulme and Nation (2020) note that the failure to find qualitative differences between poor readers with and without an IQ gap led the discrepancy definition to “fall from favour,” but that loosening the criteria also caused “diagnostic confusion.” Elliott and Grigorenko (2024) argue that diagnosing by the IDA definition then in force “often results in scientifically questionable diagnoses.” Treat any 2002-era definition, and any IQ-gap rule of thumb, as out of date.

Do you need a certain IQ to be dyslexic?

No, and the history explains why people think you do. A 1968 World Federation of Neurology definition described children who fail to attain reading skills “commensurate with their intellectual abilities.” Rutter and Yule’s 1975 paper on Isle of Wight data seemed to support the discrepancy idea, on the strength of a “hump” in the distribution of reading achievement. When US regulations for Public Law 94-142 arrived in 1977, specific learning disability was identified by a significant discrepancy between IQ and achievement. Later studies questioned the original finding because it applied no exclusion criteria, so its no-discrepancy group included many children with brain injury or intellectual disability.

The evidence then accumulated against the gap rule:

  • Stuebing and colleagues (2002) meta-analyzed 46 studies of the IQ-discrepancy classification and found “little evidence in support of the validity” of it.
  • Fletcher and colleagues (1994) compared discrepancy and low-achievement definitions in 199 elementary school students and found no support for the discrepancy version; Stanovich and Siegel (1994) reached a similar conclusion with 907 children.
  • Stuebing and colleagues (2009) pooled 22 studies and found IQ explained very little of how well children responded to reading instruction (R² = 0.03).
  • IDEA 2004 (34 CFR 300.307) says states “must not require” a severe discrepancy between intellectual ability and achievement, and must permit a process based on response to research-based intervention.

Two nuances keep this from being an absolute. US rules still exclude reading problems that are primarily the result of intellectual disability, and evaluators may still look for a pattern of strengths and weaknesses relative to age, grade-level standards or intellectual development. And a 2012 Lancet review by Peterson and Pennington found that research does not support the external validity of the distinction between age-based and IQ-based definitions, yet recommends that children meeting either one be identified and treated. Dyslexia is also not all-or-nothing. In Shaywitz’s 1992 study of 414 Connecticut children, which defined dyslexia by an IQ-reading discrepancy score, it “occurs in degrees,” and the model predicted, and the data indicated, that only 7 of 25 children classed as dyslexic in grade 1 would be classed as dyslexic in grade 3. For the wider picture of how learning disabilities relate to scores, see our guides to low IQ, intellectual disability and learning disability and ADHD, autism and dyslexia test scores.

Does dyslexia lower IQ scores?

Not as a single number, but the profile is often uneven. The clearest public data come from Pearson’s technical report on the WISC-V in 24 children aged 6 to 16 with a specific learning disorder in reading. Their averages, next to matched controls, show where the gaps sit:

WISC-V index scores: 24 children with a reading disorder versus matched controls
Index Reading-disorder group Matched controls
Verbal Comprehension 91.4 104.1
Visual Spatial 98.4 106.6
Fluid Reasoning 97.6 105.7
Working Memory 89.8 106.6
General Ability Index 95.1 107.2
Naming Speed Literacy 80.0 103.8

Read this with care. It is a small group, the controls averaged 104 to 107, so the gaps overstate the distance from the norm of 100, and the report excluded the processing-speed subtests, so there is no Full Scale IQ. A much larger clinical sample points the same way: Toffalini and colleagues (2017) studied 1,049 Italian children diagnosed with a specific learning disorder on the WISC-IV and found that all subgroups shared weaknesses in working memory and processing speed, with the working-memory and processing-speed composite about one standard deviation below the general ability composite. Among adults, Callens and colleagues (2012) compared 100 Dutch-speaking students with dyslexia and 100 without learning disabilities and found no significant difference in fluid intelligence, and slightly lower crystallized scores, which they attributed to retrieving verbal information from long-term memory. The authors also warn that university samples may be selected by admission criteria. Our guides to WISC-V index scores, full-scale IQ versus index scores and reading an IQ test report explain why one number can hide an uneven profile, and the Woodcock-Johnson guide covers the achievement tests that measure reading directly.

Can reading itself change IQ scores?

It may, which is one reason group averages need care. Ferrer and colleagues (2010) reported that in typical readers reading and IQ develop in a dynamically linked way over time, a pattern “not perceptible in dyslexic readers,” suggesting the two develop more independently. In a general-population twin sample of 1,890 identical pairs tested from age 7 to 16, Ritchie, Bates and Plomin (2015) found that earlier within-pair differences in reading were associated with later differences in intelligence, not explained by reading exposure and not limited to verbal tasks. That study did not examine dyslexia, and Stanovich’s 1986 “Matthew effect” idea that reading experience feeds cognitive growth has been contested, but together they raise the possibility that less reading practice could hold back vocabulary-heavy scores over time. Our guides to reading and IQ and verbal versus non-verbal scores cover the same ground from other angles.

What do genes have to do with it?

A great deal, and it is polygenic. Family studies put heritability at up to 70%. A genome-wide study by Doust and colleagues (2022) in Nature Genetics, compared 51,800 adults who reported a dyslexia diagnosis with 1,087,070 controls and found 42 independent genome-wide significant loci, 15 of them in genes linked to cognitive ability or educational attainment and 27 new. Polygenic scores explained up to 6% of the variance in reading traits, so they are nowhere near a diagnostic test. Genetic correlations with cognitive measures were negative but partial, ranging from −0.19 for childhood and adolescent performance IQ to −0.50 for adult verbal-numerical reasoning, none beyond 0.5. Of 75 previously reported dyslexia associations, none reached genome-wide significance in the new analysis. The authors note the limits: self-reported diagnosis in a consumer-genetics cohort, with potential collider bias. Our guide to whether IQ is genetic covers the parallel debate for intelligence.

Your own number

Where would your own score land?

Take the IIF-certified assessment and get your score with the scale it was measured on, the percentile it corresponds to and the confidence range around it — the three figures most online tests leave out.

Find your IQ score now! →

Secure & encryptedInstant results10–20 minutes

Are dyslexic people more intelligent, or more likely to be entrepreneurs?

No source we reviewed reports higher IQ in dyslexia. The British Dyslexia Association says many dyslexic people show strengths in reasoning and in visual and creative fields, but its page gives no citation for that sentence, and Callens found no difference in fluid intelligence. The most repeated statistic is that 35% of US entrepreneurs are dyslexic. It traces to Julie Logan’s 2009 survey, in which 102 entrepreneurs and 37 corporate managers responded, a 7.0% response rate. Of the entrepreneurs, 36 (35%) scored four or more traits on a dyslexia checklist, against 3 of 37 managers (8%). A checklist is a trait screen, not a diagnosis, and Logan cautioned that the corporate sample was too small to test for an effect. The result is an association in a small, low-response, self-selected sample, and it says nothing about IQ or about whether dyslexia causes business success.

Claims that Einstein, Edison or da Vinci were dyslexic are posthumous labels. A diagnosis rests on standardized reading and spelling tests that cannot be given to historical figures, and a 1987 paper in the Journal of Learning Disabilities asked whether such figures were really learning disabled at all. For a related myth about a different condition, see ADHD and IQ.

How is dyslexia identified, and where does IQ fit?

Assessment focuses on word reading, spelling and decoding, plus phonological awareness and rapid naming. In the Pearson data above, the largest gap of all was on naming speed for literacy (80.0 against 103.8). Peterson and Pennington note that diagnosis “requires setting a somewhat arbitrary cutoff on a continuous variable,” which is why prevalence depends on the definition: about 7% at a cut-off of 1.5 standard deviations below the mean, and roughly one in ten children in Doust’s genetics paper. US law lists dyslexia among the conditions that can be a specific learning disability; in the UK, the British Dyslexia Association reads the Equality Act 2010 as covering dyslexia as a disability, although whether a particular person is covered depends on the Act’s “substantial” and “long-term” test. Only a qualified assessor can diagnose, and an online IQ quiz cannot. Timed, text-heavy online tests were not evaluated in the research we reviewed, so a low score on one is not a finding. IQ is a weak predictor of how children respond to reading instruction (the 2009 meta-analysis above), which is why identification leads to teaching rather than to an IQ verdict; for what persistence traits add on top, see our guide to grit vs IQ. The idea of being gifted and having a learning difficulty at once (twice-exceptional) is covered in our guide to high IQ and ADHD, and IQ testing for children covers the assessments themselves.

Quick answers

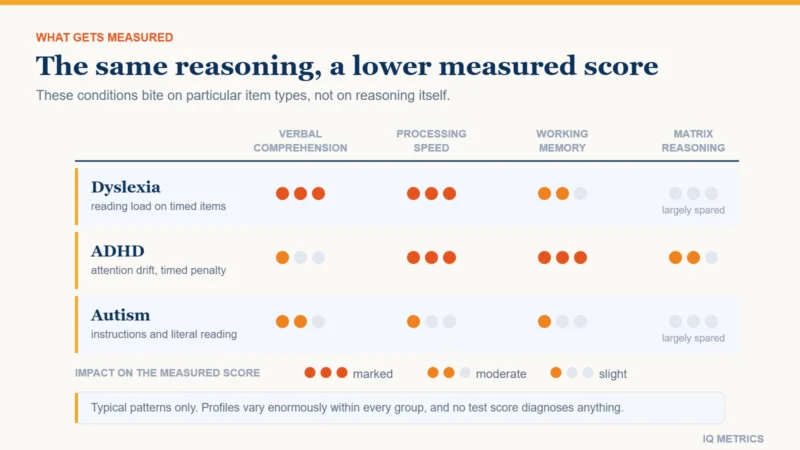
  • Does dyslexia lower IQ? Not as such. Group averages on some index scores, especially working memory and verbal comprehension, run lower, but individuals vary widely.
  • Can you be dyslexic with a high IQ? Yes. The Rose Review says dyslexia occurs across the range of intellectual abilities.
  • Do you need an IQ score to be diagnosed? No. US rules say states must not require a severe IQ-achievement discrepancy, and UK definitions have no IQ criterion.
  • Did the definition of dyslexia change? Yes. The IDA adopted a new definition on 22 October 2025 that drops “unexpected,” and the British Dyslexia Association now presents a 2025 Delphi definition.
  • How common is dyslexia? About 7% at a cut-off of 1.5 standard deviations below the mean, roughly one in ten children in a 2022 study; the figure depends on the definition.
  • Is dyslexia genetic? Partly. Family studies suggest heritability up to 70%, and a 2022 study found 42 associated loci, but polygenic scores explain up to 6% of variance in reading traits.
  • Are 35% of entrepreneurs dyslexic? No. 36 of 102 survey respondents scored four or more traits on a checklist, at a 7.0% response rate.

The bottom line

Dyslexia is a reading-and-spelling difficulty that occurs at every level of IQ. The idea that you need an IQ gap to qualify has been dropped from US special-education rules and, as of October 2025, from the International Dyslexia Association’s own definition. What IQ tests can add is a profile: in the data above, lower working-memory and verbal scores than reasoning scores, with wide variation between individuals. That is a description of strengths and weaknesses, not a verdict on intelligence, and it cannot come from an online quiz.

Sources

Share this article

Know someone who keeps seeing these numbers quoted without the scale they were measured on? Send it to them.

Tagged can you be dyslexic with a high iq, does dyslexia lower iq, dyslexia and intelligence, dyslexia and iq, dyslexia definition 2025, dyslexia genetics, dyslexia iq test, dyslexic entrepreneurs myth, ida dyslexia definition, intelligence research, IQ achievement discrepancy, IQ Science, rose review dyslexia, specific learning disorder, wisc-v dyslexia profile

Adoption and IQ

Research & Evidence

Adoption and IQ: What Adoption Studies Show About Nature and Nurture

Adoption can raise average IQ by about 3 to 4 points in a large Swedish sibling study and by 8 to 20 in a French study of neglected children, yet adoptees come to resemble their birth parents. See what adoption and twin studies show, and what they cannot.

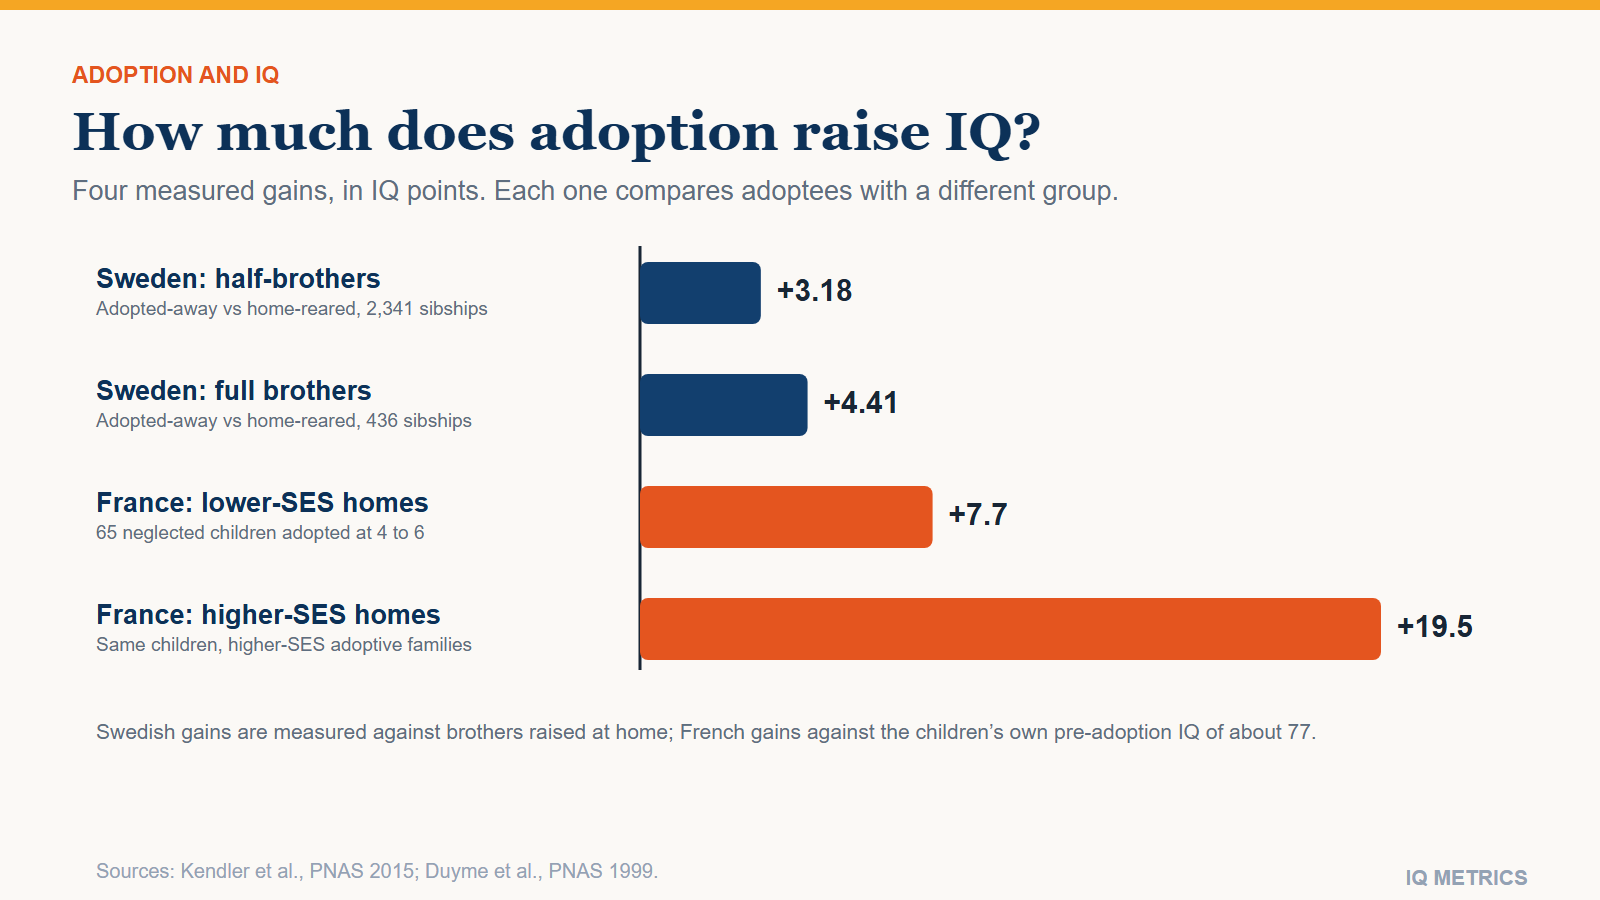
A bar chart shows four measured IQ gains from adoption, each against a different comparison group: 3.18 points in a Swedish half-sibling comparison, 4.41 points in a Swedish full-sibling comparison, 7.7 points for neglected French children adopted into lower-SES homes and 19.5 points for those adopted into higher-SES homes.

Adoption and IQ: does adoption raise a child’s IQ? Adoption studies show that the home a child grows up in can move average IQ, and how far depends on where the child starts: about 3 to 4 points in a large Swedish sibling study, and roughly 8 to 20 points in a French study of neglected children moved into better-off homes. But adopted children’s IQ also comes to resemble their birth parents’ more than their adoptive parents’ as they grow up, and identical twins reared apart correlate about .70 in adult IQ. Both findings hold at once: environment can shift the average level, especially for children in poor starting conditions, while genes account for more of the differences among people raised in ordinary, similar-quality homes. This guide sets out what each major study measured, what the numbers are, and what adoption designs cannot show.

  • Swedish siblings (2015): adopted-away men scored 4.41 IQ points higher than their home-reared full brothers (436 sibships); a half-sibling replication gave 3.18 points (2,341 sibships).
  • French adoptees (1999): neglected children with a pre-adoption IQ near 77 gained 7.7 points in lower-SES adoptive homes and 19.5 points in higher-SES homes by adolescence.
  • Colorado Adoption Project: adoptees resembled their adoptive parents slightly in early childhood but not at all by adolescence.
  • Twins reared apart (1990): an identical-twin IQ correlation of .69 on the Wechsler adult scale, with a warning not to extend it to extreme disadvantage.
  • Romanian institutions: at age 8, children placed in foster care averaged IQ 81 against 107 for never-institutionalized children.
A bar chart shows four measured IQ gains from adoption, each against a different comparison group: 3.18 points in a Swedish half-sibling comparison, 4.41 points in a Swedish full-sibling comparison, 7.7 points for neglected French children adopted into lower-SES homes and 19.5 points for those adopted into higher-SES homes.

Why do researchers use adoption studies?

An adopted child inherits genes from one family and grows up in another, which pulls apart two things that are tangled together in ordinary families. If adoptees end up resembling their birth parents, genes are doing the work; if they resemble their adoptive parents, or outscore siblings who stayed behind, the home is. Adoption designs have limits, and the biggest is that adoptive parents are screened and are on average better off than birth parents, a point we return to below. For the wider debate see our guides to whether IQ is genetic, twin studies and IQ and socioeconomic status and IQ.

Does adoption raise IQ? What the meta-analysis found

The broadest evidence is a 2005 meta-analysis in Psychological Bulletin by van IJzendoorn, Juffer and Klein Poelhuis, covering 62 studies and 17,767 adopted children. Its answer depends on the comparison group. Adopted children scored higher on IQ tests than the siblings or peers who stayed behind. They did not differ in IQ from their nonadopted peers or siblings in their new communities, though their school performance and language abilities lagged behind and more of them developed learning problems. In other words, adoption looks like a large improvement relative to what the child left behind, and like a normal starting point relative to peers in the new community.

A widely quoted range comes from Nisbett and colleagues (2012), who describe a 12-point to 18-point rise in IQ when children are adopted from working-class to middle-class homes. They add that the meta-analysis figure of 18 points included comparisons with extremely deprived institutional settings. Those are large numbers, and the designs below suggest they sit at the top of the range rather than being the typical case.

How big is the gain? Four measured numbers

The Swedish study uses national registers and gives the most cautious estimate. Kendler and colleagues (2015) used national registers to find male siblings where one was raised by biological parents and the other was adopted away, with IQ taken from the military conscription exam at age 18 to 20. Across 436 full-sibling sets the adopted brother scored 4.41 points higher (standard error 0.75); a replication with 2,341 half-sibling sets gave 3.18 (standard error 0.34). The authors call this smaller than differences in earlier, smaller studies, and note that the environmental difference between the adoptive and biological families was not especially large and that the adoptive families were screened by the adoption agency. The effect also ran both ways: children placed in the best-educated homes scored highest, while those placed in homes less educated than the family of origin “actually performed worse” than their siblings.

The French study shows a bigger effect at a lower starting point. Duyme, Dumaret and Tomkiewicz (1999) picked 65 children, from 5,003 adoption files, who had been abused or neglected in infancy and were adopted between ages 4 and 6, with a pre-adoption IQ below 86 (mean 77). By adolescence the mean IQ was 85 in adoptive families of lower socioeconomic status (SES) and 98 in higher-SES ones, gains of 7.7 and 19.5 points. One caution is ours, not the paper’s: children chosen for a low first score tend to score somewhat higher on retest by chance alone, the effect described in our guide to regression to the mean, so some of the 7.7 may reflect that statistical rebound rather than adoption itself. A classic 1989 French cross-fostering study of 38 children, as summarized in a 2018 review, found children born to higher-SES families and adopted into lower-SES homes averaged 107.5, against 103.6 for children born to lower-SES families and adopted into higher-SES homes, which suggests, on our reading, that birth background and adoptive home both mattered.

Four adoption gains, and what each compares
Study Comparison Gain
Kendler et al. 2015, Sweden (half-siblings) Adopted-away men against home-reared half-brothers, 2,341 sibships, IQ at conscription 3.18 points
Kendler et al. 2015, Sweden (full siblings) Adopted-away men against home-reared full brothers, 436 sibships 4.41 points
Duyme et al. 1999, France (lower-SES homes) 65 neglected children adopted at 4 to 6, pre-adoption IQ near 77; measured in adolescence 7.7 points
Duyme et al. 1999, France (higher-SES homes) Same children, adopted into higher-SES families 19.5 points

Do adopted children come to resemble their birth parents or their adoptive parents?

The Colorado Adoption Project followed adopted children and their biological and adoptive parents for 20 years, alongside matched non-adoptive families. Plomin and colleagues reported in 1997 that adopted children resemble their adoptive parents “slightly in early childhood but not at all” in middle childhood or adolescence, while becoming more like their biological parents, to the same degree as children in non-adoptive families. A later analysis of the project’s sibling data by Petrill and colleagues (2004), covering 245 adoptive and 245 biological families with IQ measured from age 1 to 16, found considerable genetic influence at each age and modest shared-environmental influence, and reported that selective placement was negligible for the cognitive measures.

This fits a pattern documented in twin and adoption work: the share of IQ differences linked to genes rises with age. Plomin and Deary (2015) put heritability at about 20% in infancy, rising to perhaps 80% in later adulthood, with cross-sectional twin data from 11,000 pairs showing roughly 40% in childhood, 50% in adolescence and 60% in young adulthood. That is consistent with parental influence looking strongest in early childhood and weakest in adulthood. See also IQ scale by age and whether intelligence comes from mother or father.

The two findings do not contradict each other. A 2018 review by Sauce and Matzel puts it in one line: “the magnitude of a correlation is independent of changes in means.” Adoption can raise the average score of a group while genes still explain most of the differences among individuals within it.

What do twins reared apart show?

The Minnesota Study of Twins Reared Apart, reported by Bouchard and colleagues in Science in 1990, covered more than 100 sets of reared-apart twins or triplets, with the main analysis on 56 sets of identical twins. The IQ correlation was .69 on the Wechsler adult scale (48 pairs) and near .78 on other composites; three earlier studies gave .64 to .74. The authors concluded that about 70% of the variance in IQ was associated with genetic variation. Identical twins raised together, mostly children, correlated .86 across 34 studies, against .72 for the mostly adult reared-apart twins; the samples differ in age as well as in rearing, so the comparison is not clean.

The paper is also explicit about its limits. Few of the twins were reared in real poverty and none was intellectually disabled, so the estimate “should not be extrapolated to the extremes of environmental disadvantage,” and the findings “do not define or limit what might be conceivably achieved in an optimal environment.” The authors add that the evidence does not detract from the value of parenting, education and other interventions.

Your own number

Where would your own score land?

Take the IIF-certified assessment and get your score with the scale it was measured on, the percentile it corresponds to and the confidence range around it — the three figures most online tests leave out.

Find your IQ score now! →

Secure & encryptedInstant results10–20 minutes

What happens when the early environment is very poor?

The strongest evidence on severe deprivation comes from Romania. In the Bucharest Early Intervention Project, abandoned children were randomly assigned to foster care or to remain in institutions. By 42 and 54 months, children who stayed in institutions scored markedly below both never-institutionalized children and those moved to foster care, and the gains were largest for the youngest children placed. At age 8, Fox and colleagues (2011) tested 103 of the original 136 children on the WISC-IV: the foster-care group averaged 81.46, the care-as-usual group 76.16 and never-institutionalized children 107.00. The gap between foster care and care as usual was only marginal (p = .07), and the care-as-usual average rose between 54 months and age 8, partly because Romania began moving institutionalized children into foster homes. Even the foster-care group was about 25 points below never-institutionalized peers. Our guide to toxic stress and IQ covers the trial in more depth.

The English and Romanian Adoptees study followed children adopted into UK families after up to 43 months of severe deprivation. Sonuga-Barke and colleagues (2017) found that among those who had spent more than six months in an institution, rates of IQ below 80 were markedly higher than in UK-born adoptees at ages 6 (p = .0001) and 11 (p = .0016), but had fallen to normal rates by age 22 to 25 (p = .76). Other difficulties did not fade: autism-spectrum-like symptoms, disinhibited social engagement and inattention stayed higher, and about a fifth of that group (15 people) had no problems at any assessment. IQ can recover when the environment improves, but a score is not the whole picture. For more on adversity and thinking skills, see our news piece on childhood adversity and cognition.

What adoption studies cannot show

  • Adoptive homes are screened. Adoptive parents are on average better off than birth parents. Nisbett and colleagues argue this restricted range may make adoption studies underestimate environmental effects; other researchers dispute that, so it stays open.
  • The comparison group decides the answer. Left in an institution, left with birth parents, or living next door in the adoptive community give very different gains.
  • Birth-family effects are not only genes. Prenatal conditions travel with birth mothers, and parental education is only an imperfect indicator of environmental quality, as Kendler and colleagues note.
  • Extreme deprivation is not ordinary adoption. The Romanian studies show what happens at the far end and should not be stretched to typical adoptions.
  • Numbers differ by test and age. The studies used different tests at different ages, from military conscription exams in Sweden to the WISC-IV in Bucharest and the Wechsler adult scale in Minnesota, so gains in points are not perfectly comparable.
  • Nothing here describes an individual. These are averages across groups. They say nothing about any one child’s potential or any one family’s parenting.

Adoption research also reaches beyond IQ. In a natural experiment in which Korean-born adoptees were quasi-randomly assigned to American families, Sacerdote (2007) found that parents’ education and family size predicted adoptees’ education, income and health more than parents’ income did, and that shared family environment explained 14% of the variation in educational attainment. That study did not measure IQ. Traits such as persistence are shaped by genes as well: in a UK twin study, perseverance of effort was 37% heritable, a finding covered in our guide to grit vs IQ.

Quick answers

  • Does adoption raise IQ? On average, yes, relative to siblings or peers left behind: about 3 to 4 points in a Swedish sibling comparison and roughly 8 to 20 points in a French study of neglected children. Adoptees do not differ in IQ from peers in their new communities.
  • Do adopted children take on their adoptive parents’ IQ? Not by adolescence. In the Colorado Adoption Project they resembled adoptive parents slightly early on and not at all by middle childhood.
  • How much of IQ is genetic? It rises with age, from about 20% in infancy to perhaps 80% in later adulthood, and about 70% in the Minnesota twin study of mostly middle-class adults.
  • Does early neglect permanently lower IQ? Not always. Romanian adoptees with more than six months of deprivation had normal rates of IQ below 80 by age 22 to 25, though other difficulties persisted.
  • Does high heritability mean parenting does not matter? No. The twin authors say their findings do not detract from the value of parenting and education, and the Swedish authors say the malleability they found is fully consistent with genetic influence.

The bottom line

Adoption studies say two things that sound opposed but are not. Environment can change the average IQ of a group, by a few points in ordinary comparisons and by much more when children leave severe deprivation. And as children grow, differences between people raised in ordinary homes track their birth parents more than their adoptive ones. Both come with limits: adoptive homes are screened, deprivation studies describe extremes, and none of the numbers applies to a single child.

Sources

Share this article

Know someone who keeps seeing these numbers quoted without the scale they were measured on? Send it to them.

Tagged adopted children iq, adoption and iq, adoption studies nature vs nurture, bucharest early intervention project, colorado adoption project, cross-fostering adoption study, does adoption raise iq, heritability of iq by age, intelligence research, IQ Science, kendler adoption study sweden, minnesota twin study, romanian adoptees iq, twins reared apart iq