IQ Metrics
IIF Certified Assessment Start IQ Test
IIF Certified Assessment

How to Read an IQ Test Report

Scores & Scales

How to Read an IQ Test Report: FSIQ, Indexes and Confidence Intervals

An IQ report puts numbers on at least three different scales and almost never explains which of them matters. Here is what FSIQ, the index scores, the subtest scaled scores, the percentile rank and that bracketed range each mean, and when the headline number should not be read at all.

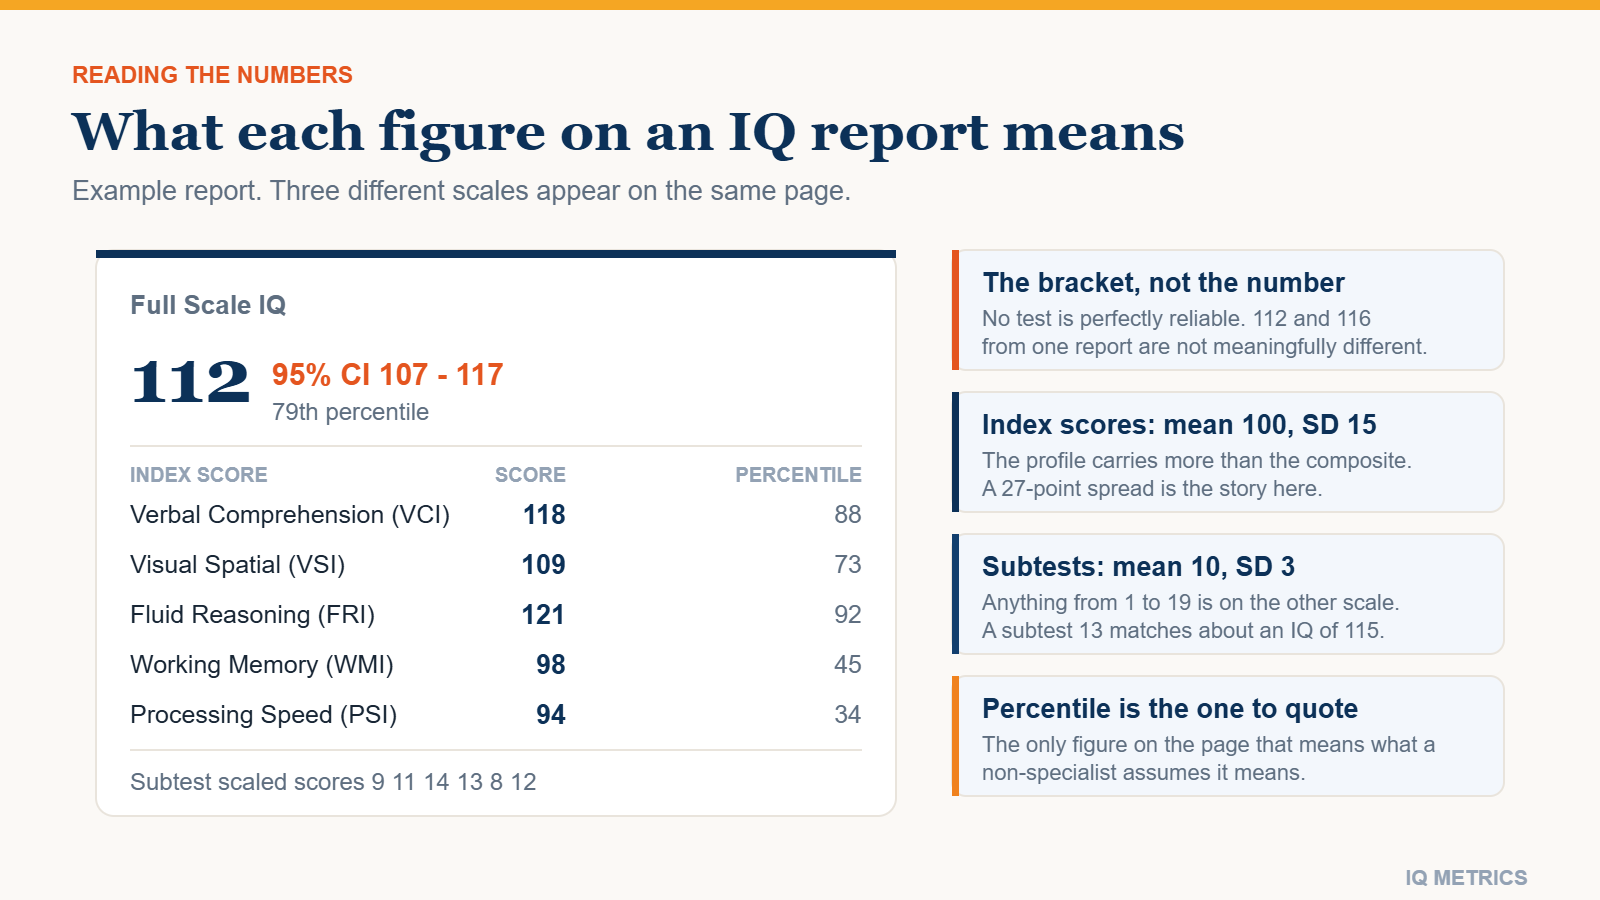
Annotated layout of a typical IQ test report showing the Full Scale IQ with its confidence interval, the index scores on a mean of 100, the subtest scaled scores on a mean of 10, and the percentile rank column

An IQ test report puts numbers on at least three different scales on the same page, and it rarely says so. The Full Scale IQ and the index scores use a mean of 100. The subtest scores use a mean of 10. The percentile rank is on a scale of 1 to 99 and is not a percentage of anything. Read them as though they were comparable and you will draw the wrong conclusion within about thirty seconds.

This guide walks the report from the top down: what each number is, what a normal amount of variation looks like, and the one circumstance in which the headline figure should be set aside entirely. It covers the Wechsler family — the WAIS for adults and the WISC for children — because those account for the large majority of reports people are handed.

Full Scale IQ, and the bracket after it

The Full Scale IQ (FSIQ) is the composite: a single figure derived from the subtests, scaled so that the population average is 100 and the standard deviation is 15. Around two-thirds of people fall between 85 and 115, and about 95 per cent between 70 and 130. Our IQ bell curve page shows the distribution these figures come from.

Immediately after it you will usually see something like 112 (95% CI: 107–117). That bracket is a confidence interval, and it is the most informative and most ignored item on the page. It exists because no test is perfectly reliable: retest the same person and the score moves a little. The interval is the band within which the true score most plausibly sits. For the FSIQ on a modern Wechsler battery it is typically around plus or minus four to five points.

The practical consequence: a 112 and a 116 from the same report are not meaningfully different, and neither are two people three points apart. Treating a single point as informative is the single most common misreading of these reports, and it is the reason our article on what an IQ score really means leads with the range rather than the point estimate.

Index scores: the four or five numbers that matter more

Beneath the FSIQ sit the index scores, also on a mean of 100 and a standard deviation of 15. Each summarises one broad domain. The current Wechsler scales for children and the newest adult edition use five:

  • Verbal Comprehension (VCI) — word knowledge, verbal concepts, acquired verbal reasoning.
  • Visual Spatial (VSI) — construction and analysis of visual material, block-design style tasks.
  • Fluid Reasoning (FRI) — inferring rules from novel patterns, closest to the matrix items on an online test.
  • Working Memory (WMI) — holding and manipulating information over short intervals.
  • Processing Speed (PSI) — how quickly simple, well-defined visual tasks are completed.

Older reports, including those using the WAIS-IV, combine the second and third into a single Perceptual Reasoning Index, giving four rather than five. If your report shows PRI instead of VSI and FRI, that is which edition was administered, not an omission. The domains map closely onto the ability structure described on our page about how IQ tests work.

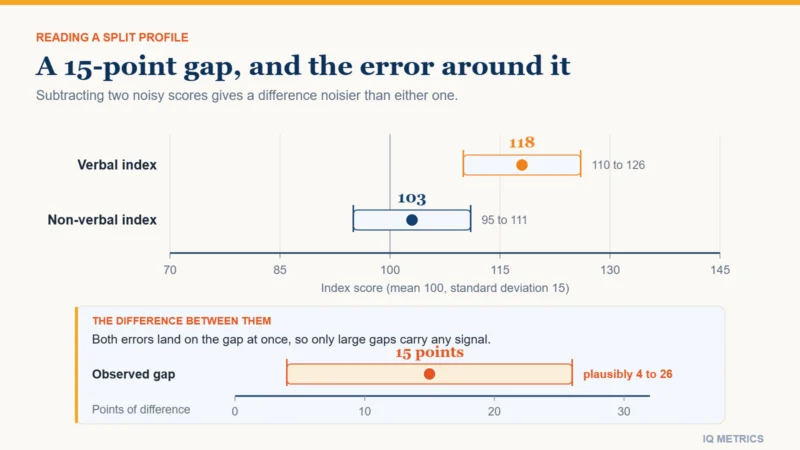
For most purposes the index profile is more useful than the FSIQ. A single composite averages away exactly the pattern that a referral question usually turns on — strong verbal ability alongside weak working memory says something specific, and it disappears entirely once it is folded into one number.

Annotated layout of a typical IQ test report showing FSIQ, index scores, subtest scaled scores and percentile rank

Descriptors, and strengths that are only relative

Most reports attach a word to each score — Average, High Average, Superior and so on. These are labels for bands on the same scale, they vary between publishers and editions, and newer manuals have deliberately moved away from the older, more stigmatising terminology at the low end. Read the number and the percentile; treat the adjective as shorthand. Our article on IQ classifications sets out how the bands are drawn and why they differ.

One further distinction causes constant confusion. A normative strength means high compared with the general population. A personal or relative strength means high compared with the rest of your own profile. Someone can have a personal strength in verbal comprehension that is still below the population average, and a personal weakness in processing speed that is comfortably above it. Good reports say which sense they mean; not all of them do.

Scaled scores: the numbers between 1 and 19

Individual subtests are reported as scaled scores on a completely different metric: a mean of 10, a standard deviation of 3, and a practical range of 1 to 19. A scaled score of 10 is exactly average. 13 is one standard deviation above; 7 is one below.

The trap is obvious once stated. A subtest score of 12 is a good result, and an index score of 12 would be impossible. If a number in the report is between 1 and 19 it is a subtest and it lives on the mean-of-10 scale — multiply the distance from 10 by five and add 100 for a rough IQ-scale equivalent, so a 13 is roughly the same standing as a 115.

Subtest scores are also the least reliable figures on the page. Individual subtests have narrower reliability than composites, so their confidence intervals are proportionally wider. Modern practice discourages interpreting a single low subtest in isolation, which does not stop people doing it.

Your own number

Where would your own score land?

Take the IIF-certified assessment and get your score with the scale it was measured on, the percentile it corresponds to and the confidence range around it — the three figures most online tests leave out.

Find your IQ score now! →

Secure & encryptedInstant results10–20 minutes

Percentile rank: the number to quote

The percentile rank says what share of the reference group scored at or below that level. An FSIQ of 100 is the 50th percentile. 115 is roughly the 84th; 130 is roughly the 98th. It is not a percentage score and has nothing to do with how many items were answered correctly.

If you plan to explain a result to anyone, the percentile is the figure to use. It is the one number on the report that means what a non-specialist assumes it means. Our IQ percentile calculator converts in either direction, and the score converter handles the other complication — some tests use a standard deviation of 16 rather than 15, so the same percentile carries a different IQ number.

When the Full Scale IQ should not be reported

There is one genuinely technical rule that reports often apply without explaining. If the index scores differ from each other sufficiently — a large gap between the highest and lowest — the FSIQ is describing an average of things that are not behaving alike, and psychologists will say it should be interpreted with caution or not at all.

In that situation many reports substitute the General Ability Index (GAI), a composite built from the verbal and reasoning indices only, leaving out working memory and processing speed. It is used when those two are depressed by something that is not general ability — attention difficulties, anxiety, motor slowing. Because processing speed is the least g-loaded index, a low PSI can pull an FSIQ down several points while telling you very little about reasoning.

A large split of this kind is common in the profiles discussed in our article on ADHD, autism, dyslexia and IQ scores, which is exactly why the GAI exists.

What else belongs in a real report

A competent report is not just a score table. Look for all of these; their absence is informative:

  • The referral question — what the assessment was actually asked to establish.
  • The test edition and date. Norms age, and an obsolete edition inflates scores.
  • Behavioural observations during testing — effort, attention, fatigue, whether the result is considered a valid estimate.
  • A statement of validity. A report that never says whether the examiner believed the result is not finished.
  • Recommendations tied to the profile rather than to the headline number.

And one thing that should not be there: a diagnosis derived from scores alone. An IQ report describes cognitive performance on a given day. Anything beyond that requires other evidence.

If your report came from an online test

Online tests, ours included, produce a much simpler output and should be read more cautiously. There is no examiner, no behavioural observation and no validity judgement, so the result is an estimate of where you sit rather than a clinical finding. We set out what that does and does not support on our IQ test accuracy page, and what a well-built online test should disclose.

Used for what it is — a normed benchmark rather than an assessment — it is a reasonable starting point. Our free IQ test reports a score against age norms with the percentile alongside it, which is the same pair of numbers you should be reading first on any report.

Share this article

Know someone who keeps seeing these numbers quoted without the scale they were measured on? Send it to them.

Tagged confidence interval, full scale iq, general ability index, Index Scores, intelligence test, iq assessment, iq scale, IQ Score, iq scoring, iq test results, iq test score, Measurement Error, percentile rank, professional iq test, scaled scores, standard deviation iq, wechsler adult intelligence scale

Processing Speed and IQ

Understanding IQ

Processing Speed and IQ: Does Thinking Fast Mean Thinking Well?

Fast thinkers are assumed to be smart thinkers, and there is a real finding underneath the stereotype: people who score higher on IQ tests do respond faster on tasks with no reasoning content at all. But the link is weaker than the folklore, and on a professional battery the speed index is the least g-loaded.

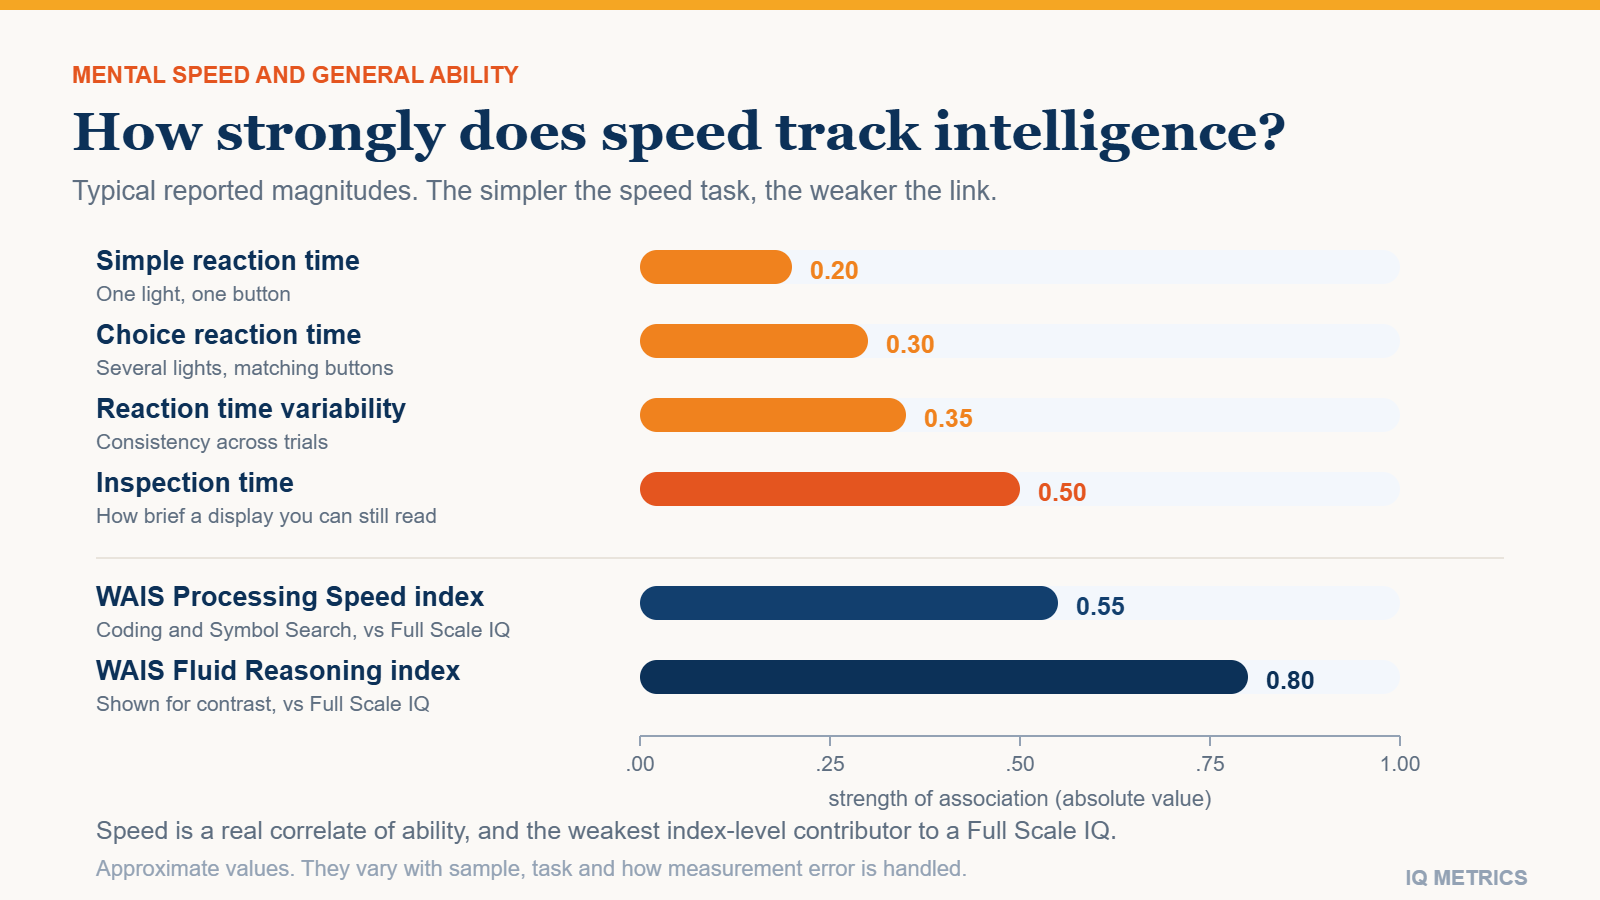
Diagram showing where processing speed sits in the structure of cognitive ability, with simple reaction time, choice reaction time and inspection time on one axis and their differing strength of association with general intelligence shown alongside

Processing speed and IQ are genuinely related, but far less tightly than the stereotype of the quick-witted genius suggests. People with higher IQ scores do respond faster on tasks that contain no reasoning at all — pressing a button when a light comes on — and that finding has held up for over a century. The association is real. It is also modest, and it gets stronger the more complex the speed task becomes, which tells you something important about what is actually going on.

This matters practically, because speed shows up in three different places: as an index on professional batteries, as a time limit on almost every online test, and as the main casualty of cognitive ageing. Those three are often confused with each other.

Reaction time: the oldest finding in the field

The idea that mental speed underlies intelligence goes back to Francis Galton in the 1880s and was revived by Arthur Jensen in the 1970s. The modern version uses a simple apparatus: a light comes on and you press a button. In the simple reaction time version there is one light and one button. In choice reaction time there are several lights and you must press the matching button.

  • Simple reaction time correlates with IQ only weakly — typically around -0.2 (negative because faster means a lower time and a higher score).
  • Choice reaction time correlates more strongly, and the correlation rises as the number of alternatives rises.
  • Variability in reaction time — how inconsistent someone is across trials — often predicts IQ better than their average speed does.

That last point is the interesting one and it is frequently overlooked. Being reliably quick appears to matter more than being occasionally very quick. Reviews of this literature generally place single-task correlations in the low-to-moderate range, with higher values when several speed measures are combined into a composite rather than used one at a time.

Inspection time

A related paradigm removes the motor response entirely. In an inspection time task, two lines of different lengths flash on screen for a very brief interval and you say which was longer. There is no speed of response involved — you can take as long as you like to answer — only how brief a display you can still make sense of. Meta-analyses of this task have reported associations with IQ around -0.5 once corrections for measurement error and restricted range are applied, making it one of the stronger elementary correlates of general ability.

Where speed sits on a professional test

On the Wechsler batteries described in our guide to professional IQ tests, processing speed is one of the four or five index scores that feed the Full Scale IQ. It is measured with tasks like Coding (matching symbols to digits against the clock) and Symbol Search (scanning for a target shape).

Two facts about that index are worth knowing before you read a report:

  • It is usually the least g-loaded of the indices. Verbal comprehension and fluid or perceptual reasoning carry far more of the general factor than speed does.
  • It is the most easily disturbed. Fatigue, anxiety, medication, motor difficulty, vision and simple unfamiliarity with a pencil task all push it down without touching reasoning ability.

That combination is exactly why psychologists sometimes report the General Ability Index alongside the Full Scale IQ — a composite that leaves working memory and processing speed out. If a report in front of you shows one, our guide to reading an IQ test report explains when that substitution is appropriate.

Diagram showing where processing speed sits in the structure of cognitive ability

Why online tests time you

Almost every online test imposes a limit, and the reason is psychometric rather than dramatic. Without one, reasoning items stop discriminating: given unlimited time, a large majority of test-takers eventually solve a mid-difficulty matrix, so the item no longer separates anyone from anyone. A time limit keeps the difficulty spread usable across the whole range.

The cost is that a timed score blends two things — how well you reason and how fast you work — and different people pay that cost differently. Someone accurate but deliberate loses points that someone quick and careless does not. This is why our timed IQ test is presented separately from the untimed formats in the test hub: they are answering slightly different questions about you.

It is also why speed-accuracy tradeoff advice is not a trick. Working slightly faster than feels comfortable usually helps on a timed test, up to the point where errors start climbing. Our guide to preparing for an IQ test covers where that point tends to sit.

Your own number

Where would your own score land?

Take the IIF-certified assessment and get your score with the scale it was measured on, the percentile it corresponds to and the confidence range around it — the three figures most online tests leave out.

Find your IQ score now! →

Secure & encryptedInstant results10–20 minutes

Can you train processing speed?

You can improve the score, and that is not the same as improving the ability. Coding-type tasks respond strongly to practice: do one twice and the second attempt is faster, because you have learned the symbol pairings rather than because you now process information more quickly. This is one reason retesting on the same battery too soon inflates a result, as we cover in the practice effect on ability tests.

The best evidence on deliberate speed training comes from large randomised trials in older adults, where speed-of-processing training produced substantial and durable improvement on the trained tasks. What it produced on untrained abilities is far more disputed, and the broader claims made for that work have been challenged repeatedly. The pattern matches the training literature generally — near transfer is well supported, far transfer is not — which is the same conclusion our page on improving your IQ reaches.

A more useful distinction is between things that raise your speed and things that were suppressing it. Sleep debt, illness, anxiety and unfamiliarity with the response format all depress measured speed without touching capacity, which is the mechanism behind test anxiety and IQ scores. Removing them recovers what was already yours; none of them make you faster than your own baseline.

Speed and ageing: the clearest real-world case

Processing speed is the single most age-sensitive part of cognition. It begins declining in early adulthood and continues steadily, and Timothy Salthouse’s influential processing-speed theory argues that much of the apparent age-related decline in reasoning and memory is a downstream consequence of that slowing rather than an independent loss.

Two mechanisms are usually proposed: when operations are slow, early results decay before later ones finish, and fewer operations fit into the available window. Statistically, controlling for speed accounts for a substantial share of the age effect on other abilities — though “accounts for” in a statistical model is not the same as “causes”, and this remains debated.

Because age-normed IQ compares you with people your own age, none of this shows up on a reported score. The number stays flat while the underlying speed changes, which our page on IQ and age charts directly.

Does thinking fast mean thinking well?

Not reliably, no. Speed is one contributor to a score among several, it is the weakest of the index-level contributors, and the deliberate-and-accurate profile is common among high scorers. Worth separating clearly:

  • Speed of elementary processing — reaction and inspection time — is modestly related to general ability and is not something you can train up meaningfully.
  • Speed on a clerical task — the WAIS speed index — is only loosely related to reasoning and is easily depressed by things that have nothing to do with intelligence.
  • Speed of judgement — answering fast in conversation or in a meeting — is barely studied, closer to a personality trait, and is often the opposite of good thinking. That is the theme of why smart people make bad decisions.

If you want to see how the two behave for you specifically, take our free IQ test once under its normal limit and note where you were rushed. The gap between what you answered and what you could have answered is your own speed contribution, and it is usually smaller than people fear.

Share this article

Know someone who keeps seeing these numbers quoted without the scale they were measured on? Send it to them.

Tagged cognitive ageing, Index Scores, inspection time, intelligence test, IQ, iq scale, IQ Science, IQ Score, iq test results, iq testing, mental ability, mental speed, Processing Speed, reaction time, wechsler adult intelligence scale

Does School Raise IQ?

Research & Evidence

Does School Raise IQ? What Natural Experiments Show

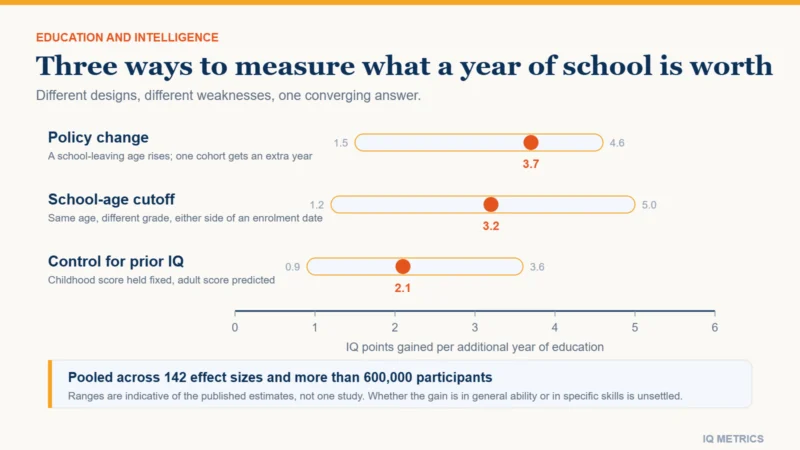
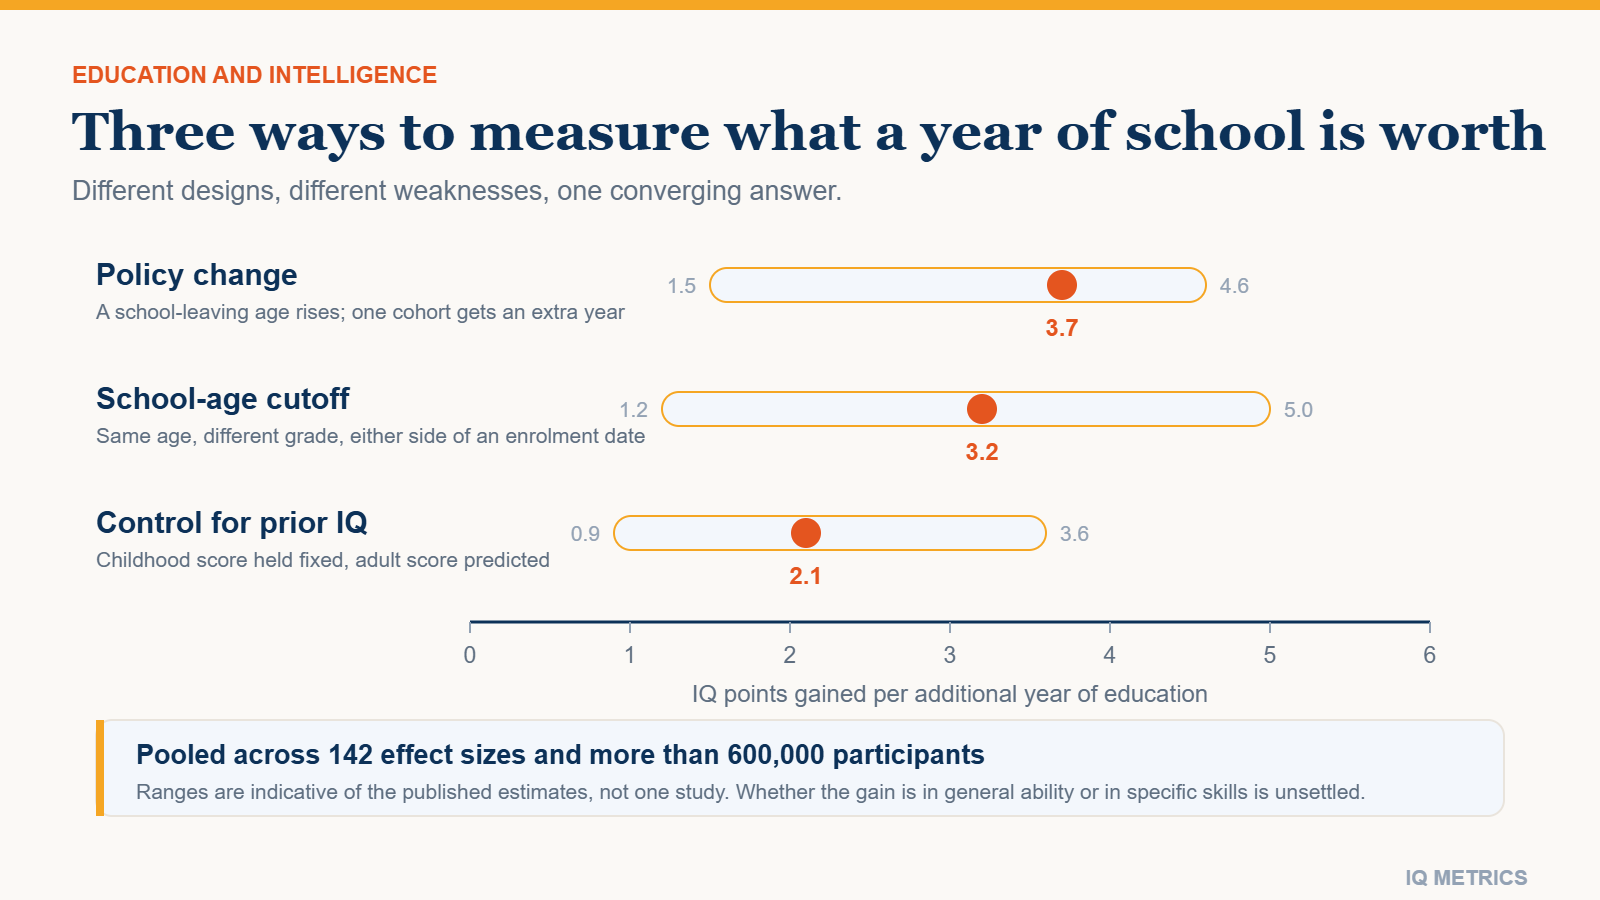
Education is the environmental factor with the strongest evidence for actually raising IQ scores, and the effect is bigger than most people expect. Three independent study designs, pooled across more than 600,000 participants, point the same way. Here is the size of it, and the caveat that gets dropped.
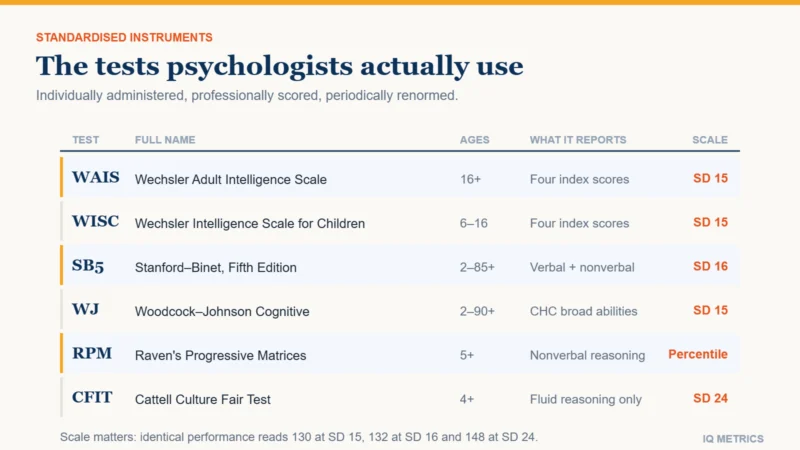
Chart showing the three natural-experiment designs used to estimate the effect of schooling on IQ (policy change, school-age cutoff and control for earlier intelligence), each yielding an estimated gain of roughly one to five IQ points per additional year of education

Yes — school raises IQ scores, and the effect is one of the largest and best-identified in the whole environmental literature. The best current estimate comes from a 2018 meta-analysis by Stuart Ritchie and Elliot Tucker-Drob, which pooled 142 effect sizes from over 600,000 participants and found that each additional year of education is associated with a gain of roughly one to five IQ points, with a central estimate of a little over three.

That is a serious number. It is comparable to the gap between the middle of the average band and its upper edge, and it appears to persist rather than fading out in the years after schooling ends. But there is a real caveat about what is being raised, and it does not get repeated nearly often enough. Both halves are below.

Why this question is hard to answer

The obvious problem is that people who stay in education longer were already scoring higher before they got there. Any raw correlation between years of schooling and adult IQ is therefore uninterpretable on its own: it could be schooling raising ability, ability raising schooling, or a third factor driving both. This is the mirror image of the question we cover in whether IQ predicts school success, and the two run in opposite directions.

What makes the modern evidence credible is that researchers stopped relying on correlations and started using natural experiments — situations where something other than the student decided how much schooling they got. Ritchie and Tucker-Drob organised the literature around three such designs:

  • Policy change. A country raises its school-leaving age, so one birth cohort gets an extra compulsory year and the cohort just before it does not. Nothing about the students themselves differs systematically.
  • School-age cutoff. Children born days either side of an enrolment cutoff are the same age when tested but have had a full extra year of school. Age is held constant while schooling varies.
  • Control for earlier intelligence. Take a measured IQ in childhood, then predict adult IQ from years of education while holding the earlier score fixed.

The three designs have completely different weaknesses. That they converge on a similar answer is the reason the finding is taken seriously.

What the natural experiments found

The compulsory schooling studies are the cleanest. A well-known analysis of a Norwegian reform, which added two years to compulsory education and rolled out across municipalities at different times, estimated a gain of roughly 3.7 IQ points per additional year on the military conscription test taken at around age 19. Because the reform arrived at different times in different places, the comparison is close to a clean experiment.

The cutoff studies attack the problem from the other end. A classic Israeli study by Cahan and Cohen compared children within the same grade who differed in age with children of the same age who differed in grade, and found that a year of schooling contributed substantially more to test performance than a year of simply getting older. Later work using the same logic in other countries reached compatible conclusions.

Chart of the three natural-experiment designs used to estimate the effect of schooling on IQ

The third design is the weakest of the three but the easiest to run at scale: measure intelligence in childhood, measure it again in adulthood, and ask whether years of education in between predict the adult score once the childhood one is held fixed. It cannot rule out every confound — motivation and family circumstances still differ — but it removes the largest one, and it produced estimates in the same broad range as the other two.

Perhaps the most striking part of the meta-analysis is that the gains did not appear to fade with age. Educational interventions in early childhood have a well-documented fadeout problem — initial score gains shrink over the following years. The schooling effect on adult IQ did not show that pattern in this analysis, which is what makes it unusual.

The caveat: raising scores is not the same as raising g

Here is the part that gets dropped in most summaries. There is good evidence that education raises performance on specific cognitive tests without raising the general factor those tests share. Ritchie, Bates and Deary examined this directly using a Scottish sample with childhood and later-life testing, and found education’s effect concentrated on individual test scores rather than on the underlying general ability that all the tests load on.

In practice that means the honest claim is narrower than the headline. More schooling reliably makes you better at the kinds of tasks tests use — vocabulary, arithmetic, structured reasoning, sustained attention under instruction. Whether it increases some deeper general capacity is genuinely unsettled, and anyone who tells you it is settled in either direction is ahead of the data. Our page on how IQ tests work explains why the distinction between a test score and the general factor matters so much here.

It is worth adding that this is not a debunking. For nearly every practical purpose — qualifications, employment, the day-to-day cognitive demands of adult life — being better at the tasks is what people actually want. The distinction matters for the theory, not usually for the decision.

Your own number

Where would your own score land?

Take the IIF-certified assessment and get your score with the scale it was measured on, the percentile it corresponds to and the confidence range around it — the three figures most online tests leave out.

Find your IQ score now! →

Secure & encryptedInstant results10–20 minutes

Why early-years gains fade but schooling gains do not

There is an apparent contradiction here worth resolving, because it is the most common objection to the whole finding. Intensive early-childhood programmes — the Perry Preschool and Abecedarian projects are the famous examples — reliably produce large IQ gains that then shrink substantially within a few years of school entry. Fadeout of that kind is one of the most replicated results in the education literature. So why would schooling itself behave differently?

The most persuasive reading, argued in John Protzko’s work on fadeout, is that cognitive gains persist roughly as long as the environmental input producing them persists, and decay once it stops. On that account a two-year preschool programme followed by nothing in particular is expected to fade. A decade of compulsory schooling is not a brief intervention at all — it is a sustained one, and the measurement usually happens while it is still running or shortly after it ends.

  • Short and intense tends to produce a large gain that shrinks — the classic fadeout curve.
  • Long and sustained tends to produce a smaller annual gain that accumulates and holds.
  • The outcome measured matters. Several programmes whose IQ advantage faded still showed durable effects on attainment, employment and earnings decades later.

This is an explanation that fits the data rather than a demonstrated mechanism, and it should be held loosely. But it does mean the two literatures are not in conflict, and it points at something useful: continuity of cognitive demand looks more valuable than intensity in a short burst.

How this fits with the heritability evidence

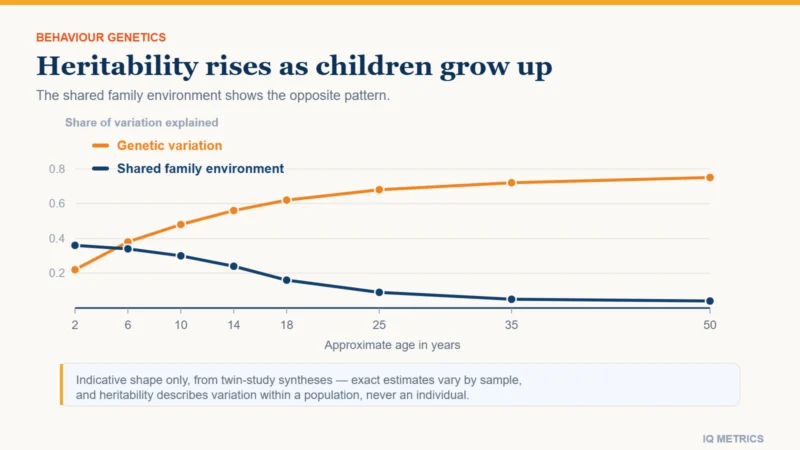
People often read a large schooling effect as evidence against a genetic contribution to intelligence, or the reverse. Neither follows. Heritability is a statistic about the sources of variation in a particular population at a particular time; it places no ceiling on how much an environmental change can move the average. Our article on whether IQ is genetic works through why a high heritability estimate and a large schooling effect are entirely compatible.

The clearest illustration is historical. Average scores rose substantially across the twentieth century in dozens of countries — far too fast for genetic change to be involved — over exactly the period in which mass secondary education spread. Schooling is not the only candidate explanation for that rise, but it is among the strongest.

What this means for you

  • If you are still studying: the effect is real and the evidence is unusually good. Staying in education longer is one of very few things with credible causal support behind it.
  • If you are past school age: the same logic suggests sustained, structured cognitive demand matters more than brief training. The evidence for short puzzle-app regimes is much weaker, which is what our page on improving your IQ covers.
  • If you are interpreting a score: a test measures you as you are now, education included. That is a feature. See how to read an IQ test report for what each number on a report actually represents.

If you want a current benchmark before drawing any conclusions, our free online IQ test scores against age-adjusted norms and takes about twenty minutes. The result will reflect everything that got you here — genetics, health, and quite a lot of schooling.

Share this article

Know someone who keeps seeing these numbers quoted without the scale they were measured on? Send it to them.

Tagged Academic Achievement, education and iq, fadeout effect, heritability of iq, intelligence test, IQ, IQ Science, IQ Score, iq testing, kids iq test, mental ability, natural experiment, nature vs nurture, School Performance, Socioeconomic Status

Why Smart People Make Bad Decisions

Mind & Everyday Life

Why Smart People Make Bad Decisions: IQ Is Not Rationality

Everyone knows someone brilliant who keeps making terrible calls. That is not a paradox; it is a measurement gap. Intelligence tests and rationality tests load on different things, and several of the best-studied thinking errors turn out to be almost completely independent of how high you score.

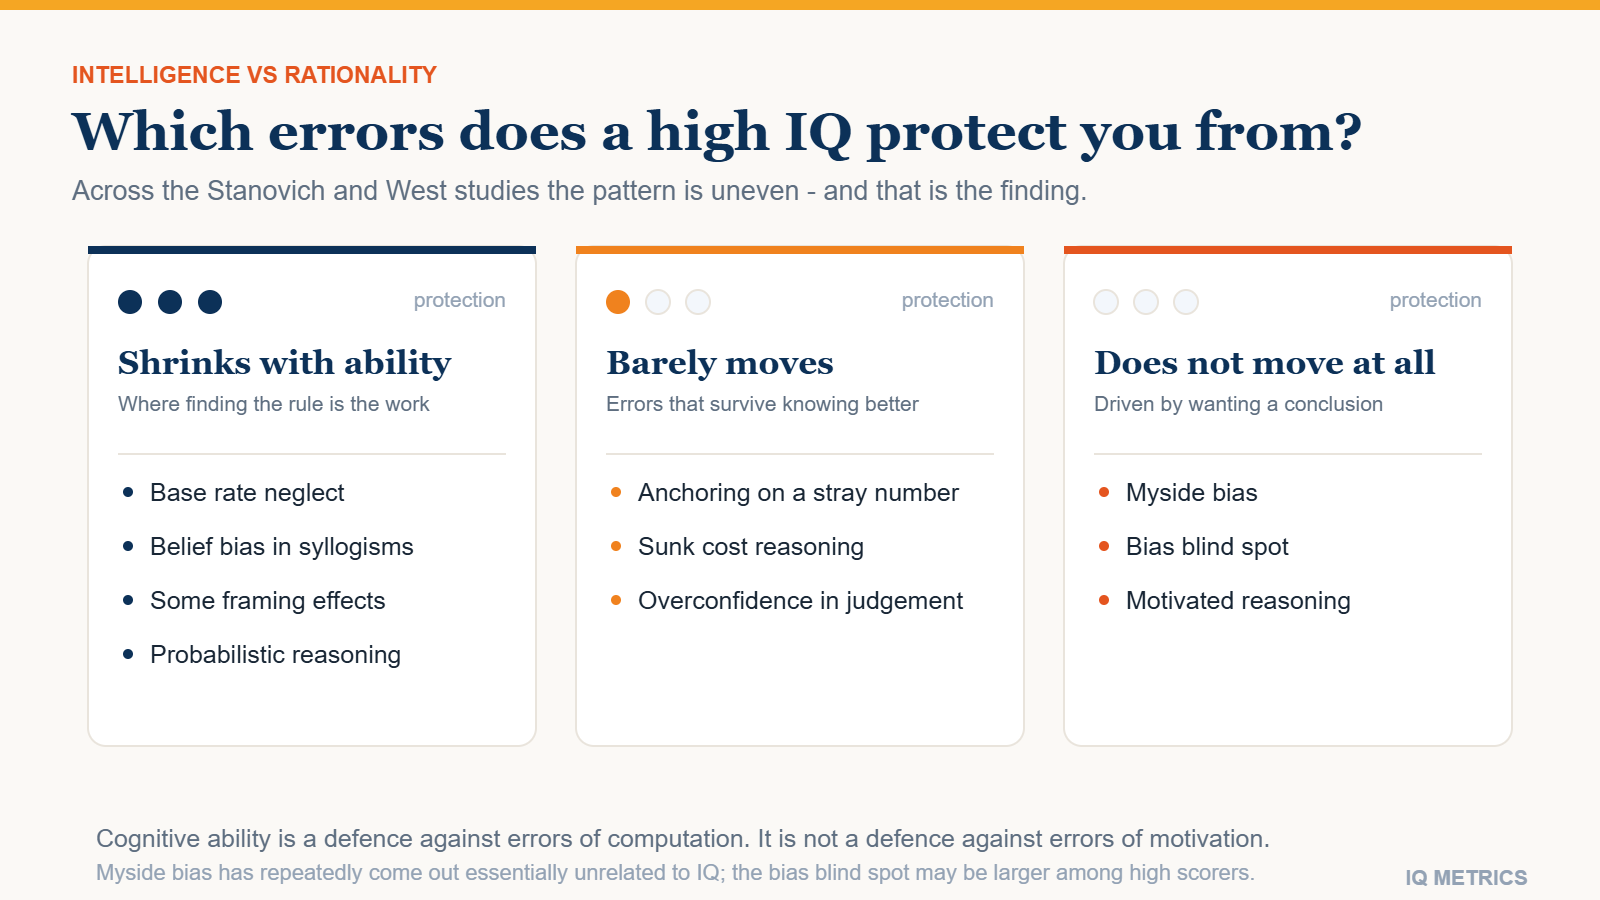
Diagram contrasting what an IQ test measures with what a rationality test measures, showing reasoning power on one side and belief calibration, myside bias and probabilistic thinking on the other, with only partial overlap between them

Smart people make bad decisions because intelligence and rationality are not the same trait, and no standard IQ test measures the second one. A high score tells you a great deal about how quickly someone spots a pattern, holds information in mind and reasons through an unfamiliar problem. It tells you much less about whether they will check their own assumptions, update on evidence that embarrasses them, or notice when a confident intuition is simply wrong.

Keith Stanovich, the cognitive scientist who has spent the longest on this gap, coined a deliberately awkward word for it: dysrationalia, the inability to think and behave rationally despite adequate intelligence. The point of the word is that the condition is common rather than exotic. Below is what the research actually shows about which errors track cognitive ability, which ones do not, and what that means for the number on your own score report.

Intelligence tests and rationality tests measure different things

An IQ battery is built to capture reasoning power under standard conditions: novel problems, clear rules, a defined right answer, and an examiner telling you exactly when to start thinking. Those conditions strip out the thing that makes real decisions hard. In life nobody announces that a question is a trick, nobody supplies the relevant base rate, and nothing signals that this is the moment to stop trusting the answer that arrived instantly.

Rationality, in the technical sense used by decision researchers, is about whether your beliefs track reality and your choices track your goals. Stanovich, Richard West and Maggie Toplak spent years building an instrument for it — the Comprehensive Assessment of Rational Thinking, published in 2016 — precisely because no existing intelligence test did the job. Their headline finding is not that the two are unrelated. It is that the association is moderate, which leaves an enormous number of people who are strong on one and weak on the other.

This is the same distinction that makes the limits of IQ as a measure worth taking seriously, and it is why our page on IQ versus personality treats traits such as conscientiousness and open-minded thinking as separate inputs rather than as by-products of ability.

The three-second question that separates them

Shane Frederick’s Cognitive Reflection Test, published in 2005, is three questions long and still one of the sharpest demonstrations in the field. The famous item: a bat and a ball cost $1.10 together, the bat costs $1.00 more than the ball, so how much does the ball cost?

The answer that arrives immediately is ten cents. It is wrong — that would make the bat $1.10 and the total $1.20. The ball costs five cents. Frederick found that large numbers of students at highly selective universities missed at least one of the three items, and those were not failures of arithmetic. Practically everyone who missed it could do the algebra on request. They simply never checked, because the intuitive answer did not feel like a guess.

That is the whole mechanism in miniature. Cognitive reflection is related to intelligence, but it predicts reasoning performance over and above it — it captures a disposition to interrupt yourself, and a disposition is not a capacity.

The biases a high score does not protect you from

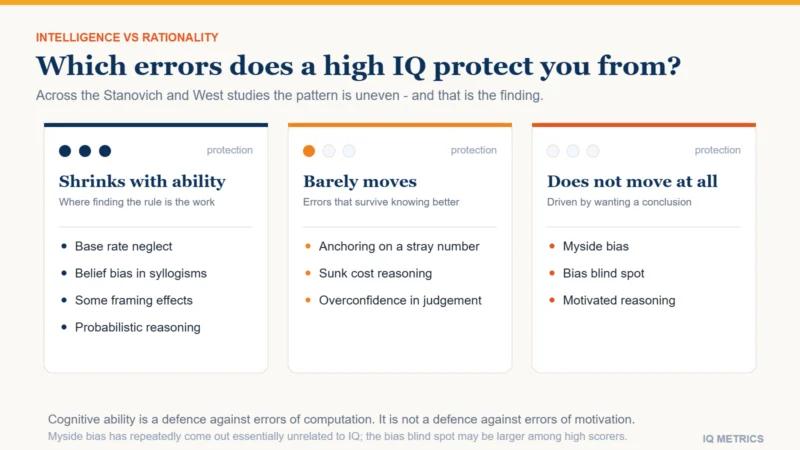
If intelligence were a general defence against thinking errors, every documented bias would shrink as ability rises. Stanovich and West tested that directly across a long series of studies, and the pattern is uneven in a way that is far more interesting than a clean result would have been.

  • Errors that do shrink with ability: base rate neglect, some framing effects, belief bias in syllogisms and several probabilistic reasoning problems — roughly, the ones where spotting the correct rule is the hard part.
  • Errors that barely move: anchoring on an irrelevant number, sunk cost reasoning in several forms, and overconfidence in your own judgement.
  • Errors that do not move at all: myside bias — evaluating evidence more generously when it supports a position you already hold. Stanovich’s group has reported myside bias effects that are essentially unrelated to cognitive ability across multiple samples.

Myside bias is the one worth sitting with. It is not a gap in knowledge or a lapse in computation, which is why more computing power does not close it. It is a bias in what gets scrutinised, and the decision about what to scrutinise is made before the reasoning starts.

When ability makes the reasoning worse

A handful of findings go further than mere independence. In a 2012 paper on the bias blind spot — the tendency to see distortions in other people’s thinking but not your own — West, Meserve and Stanovich found the blind spot was if anything larger among participants with higher cognitive ability. Being good at reasoning gives you more confidence in your reasoning, and confidence is exactly what the blind spot runs on.

Dan Kahan’s work on politically charged questions points the same way. On topics where a group identity is at stake, higher numeracy and science literacy have been associated with more polarisation between groups rather than less. The best explanation on offer is unflattering and mundane: sharper reasoners are better at constructing the case they already wanted to reach. The skill is real; it is simply pointed at justification rather than at truth. This literature is contested and the effects are modest, but the direction has appeared often enough to take seriously.

Diagram contrasting what an IQ test measures with what a rationality test measures
Your own number

Where would your own score land?

Take the IIF-certified assessment and get your score with the scale it was measured on, the percentile it corresponds to and the confidence range around it — the three figures most online tests leave out.

Find your IQ score now! →

Secure & encryptedInstant results10–20 minutes

Mindware: the part of rationality you can learn

Stanovich splits rational thinking failures into two kinds, and the split is genuinely useful. Some failures come from a processing default — going with the first answer and never overriding the intuition. Others come from missing mindware: you never acquired the rule, so there was nothing available to override it with.

Missing mindware is the encouraging half, because rules can be taught to anyone at any level of ability — and teaching is the one environmental input with genuinely strong evidence behind it, as our article on whether school raises IQ sets out. The four rules that pay for themselves quickest:

  • Ask for the base rate. A test that is 95 per cent accurate for a condition affecting one person in a thousand still returns far more false positives than true ones.
  • Consider the opposite. Explicitly writing down why your conclusion might be wrong is one of the few debiasing techniques that keeps working when it is retested.
  • Separate the decision from the outcome. A good call can lose and a reckless one can win. Judging only by results teaches you the wrong lesson a large share of the time.
  • Name the falsifier in advance. Deciding what evidence would change your mind, before you see any, is the cheapest available guard against myside bias.

What this means for your own score

None of this makes intelligence testing less useful. Cognitive ability remains one of the better-validated predictors in applied psychology, and understanding what an IQ score really means is worth doing properly. The correction is narrower than it first sounds: a score is a measurement of reasoning capacity, not a certificate of good judgement, and it was never designed to be one.

It also reframes a question people ask constantly. Whether you can raise your IQ is genuinely difficult and the honest answer is heavily qualified. Whether you can improve your decisions is not difficult at all — mindware is learnable, checking is a habit, and neither depends much on where you started. That gap is the most practical thing in this whole literature.

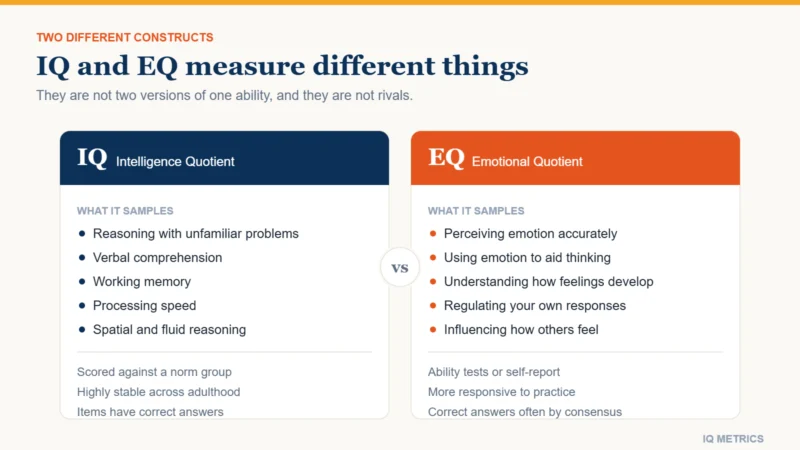
The same separation explains why IQ and emotional intelligence keep getting confused: both are real, both matter, and neither is a subset of the other. Speed of thought is a third thing again, which is why processing speed deserves its own treatment. If you want the capacity side measured properly first, our free IQ test gives you a normed score in about twenty minutes — then treat the judgement side as separate work.

The short version

  • Intelligence and rationality are related but distinct; the tests measure different constructs.
  • Errors that depend on spotting a rule shrink with ability. Errors that depend on wanting a conclusion mostly do not.
  • Myside bias is close to independent of IQ, and the bias blind spot may be worse among high scorers.
  • The learnable part — base rates, considering the opposite, separating decisions from outcomes — is available at every ability level.

The reason clever people make bad decisions is not that their intelligence failed them. It is that intelligence was never the thing being tested at that moment, and nobody told them.

Share this article

Know someone who keeps seeing these numbers quoted without the scale they were measured on? Send it to them.

Tagged cognitive bias, cognitive reflection test, Conscientiousness, decision making, dysrationalia, emotional intelligence, intelligence test, IQ, IQ Science, IQ Score, iq testing, mental ability, mental potential, myside bias, rationality

Does IQ Predict School Success?

Research & Evidence

Does IQ Predict School Success? What Fifty Years of Data Show

IQ predicts school achievement better than any other single measure psychologists have found, and still leaves roughly three-quarters of the variation unexplained. Both halves of that sentence get ignored by somebody. Here are the actual correlations, what they mean for one child, and what accounts for the rest.

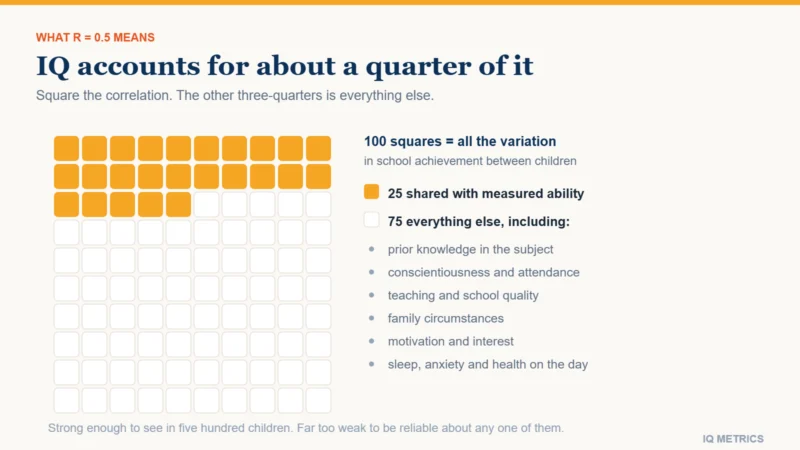
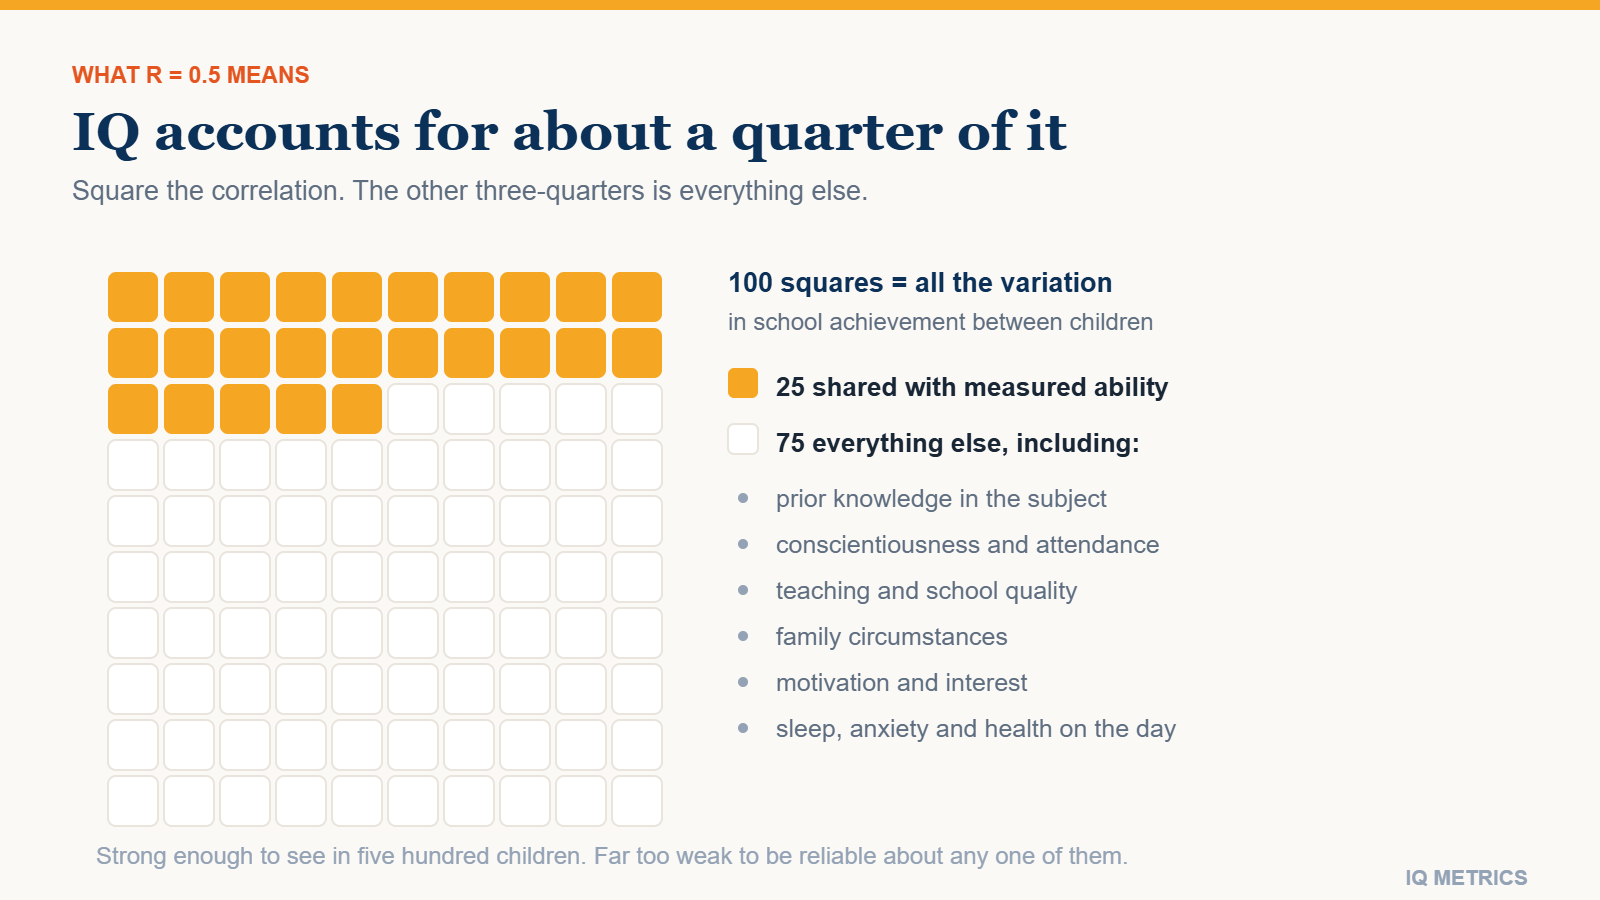
Chart showing that a correlation of 0.5 between IQ and school achievement accounts for about 25 per cent of the variation, with the remaining 75 per cent attributed to prior knowledge, conscientiousness, motivation, teaching quality and circumstance

IQ predicts school success better than any other single measure psychologists have found, and it still leaves most of the variation unexplained. Correlations between cognitive ability scores and school achievement usually land around 0.5, sometimes as high as 0.7 for standardised achievement tests in younger samples. That is a strong result by the standards of social science. It also means roughly three-quarters of the differences between children are about something else.

Almost every argument about testing in schools comes from taking one half of that sentence and dropping the other. Advocates quote the strength of the correlation to justify selecting children by it; critics quote the unexplained remainder to argue the measure is worthless. Both are reading a real number as though it answered a question it does not address.

What a correlation of 0.5 actually means

Square it. A correlation of 0.5 corresponds to about 25 per cent of the variance in the outcome being statistically associated with the predictor. Three-quarters is not.

Concretely: among children with the same IQ score, school achievement still varies enormously. The relationship is strong enough to be visible in a group of five hundred and far too weak to be reliable about any one of them. This is the single most common misreading of the literature — treating a solid group-level correlation as an individual-level forecast.

Chart showing that a correlation of 0.5 between IQ and school achievement accounts for about 25 per cent of the variation, with the remaining 75 per cent attributed to prior knowledge, conscientiousness, motivation, teaching quality and circumstance

The numbers, outcome by outcome

The correlation is not one figure. It depends heavily on what is being predicted.

  • Standardised achievement tests: about 0.5 to 0.7. The strongest relationship, and unsurprising — achievement tests and ability tests share format, timing and reasoning demands.
  • School grades: about 0.4 to 0.5. Consistently lower, for reasons worth a section of their own.
  • Years of education completed: around 0.5. Reasonably strong, but heavily entangled with family circumstances.
  • Performance within a selective university: weak. Once a group has been filtered on ability, the remaining range is narrow and the correlation shrinks accordingly.

Age matters too, and in a direction that surprises people. The correlation between measured ability and achievement tends to be strongest in the primary years and to weaken through secondary school and beyond. Part of that is restriction of range as cohorts get filtered; part is that accumulated subject knowledge, study habit and choice of subject increasingly dominate as the material gets more specialised. A reasoning test predicts best when there is least to have already learned.

That last point is restriction of range, and it explains a great deal of apparently contradictory research. A predictor always looks weaker inside an already-selected group. The same effect appears when cognitive tests are used in hiring, where the candidate pool has usually been screened already.

Why grades track IQ less closely than test scores

A grade is not a measurement of what a student knows. It is a composite of what they know, whether they handed it in, whether they attended, how they behaved, and a teacher’s judgment of all of that.

The best-known study on this point followed eighth-graders and found that a measure of self-discipline outpredicted IQ for report card grades by a substantial margin — while IQ remained the better predictor of standardised achievement test scores in the same children. Both findings are in the same paper, and quoting either one alone misrepresents it. Conscientiousness wins where sustained daily compliance is measured; ability wins where a single unfamiliar reasoning task is measured.

What accounts for the other three-quarters

  • Prior knowledge. The strongest predictor of learning something new is usually how much of the surrounding subject you already know.
  • Conscientiousness and self-discipline. Homework completion, attendance, deadline behaviour.
  • Teaching and school quality. Large effects, unevenly distributed.
  • Family circumstances. Books, quiet space, illness, stability, adult time.
  • Motivation and interest. Also partly a consequence of earlier success, which makes the causal arrows circular.
  • Test conditions on the day. Sleep, anxiety and illness all move scores, as the evidence on test anxiety shows.

A word on grit specifically, since it is often offered as the answer. Meta-analytic work suggests grit is largely a relabelling of conscientiousness and adds modest incremental prediction of academic performance beyond it. The broader point survives; the specific construct is weaker than its popularity implies.

Your own number

Where would your own score land?

Take the IIF-certified assessment and get your score with the scale it was measured on, the percentile it corresponds to and the confidence range around it — the three figures most online tests leave out.

Find your IQ score now! →

Secure & encryptedInstant results10–20 minutes

The confound that will not go away

Socioeconomic status correlates with measured ability and with school achievement independently, which makes every simple comparison ambiguous. A family with more resources supplies more books, quieter study space, better nutrition, more adult conversation, less disruption from moving house or illness, and more experience of the conventions a test is written in. All of that raises the score and the achievement at once.

Studies control for it statistically, and controlling is not the same as removing it. The variables available in a dataset — parental income, parental education, an area deprivation index — are crude stand-ins for a diffuse advantage, so residual confounding is the norm rather than the exception. Treat any estimate of the ability-achievement link as an upper bound on the causal contribution of ability, not a measurement of it.

There is one finding worth flagging because it is frequently over-read in both directions: several studies report that the heritability of cognitive ability appears lower in more deprived environments, which would imply that circumstance constrains what ability can express. The result has replicated in some samples and failed to in others, and it should be held loosely. The wider evidence on inheritance is set out in what twin studies actually show.

Causation runs both ways

It is tempting to read all this as ability causing achievement. The arrow is not one-directional.

Natural experiments exploiting changes in compulsory schooling laws find that additional years of education raise IQ scores, with estimates commonly in the range of one to five points per year. Schooling does not merely reveal ability; it partly builds the thing the test measures. That is consistent with the twentieth century’s rising scores described in why IQ norms expire, and with the careful account of what can and cannot be changed in whether you can improve your IQ. It also sits alongside the genetic evidence rather than against it: heritability describes variation in a population under given conditions, and says nothing about how much a score would move if the conditions changed.

The practical consequence is that a low score in a child who has missed a great deal of school is not a stable trait measurement. It is a reading taken partly on the schooling. Repeating the assessment after a period of consistent attendance is not redundant — it is the only way to separate the two.

What this means for one child

Four things follow, and they are the practical payoff of everything above.

  • A single score is a snapshot with an error band. Childhood scores are less stable than adult ones, as how scores change over time sets out.
  • Extreme scores drift toward the average on retesting, for statistical reasons rather than psychological ones — regression to the mean is the mechanism.
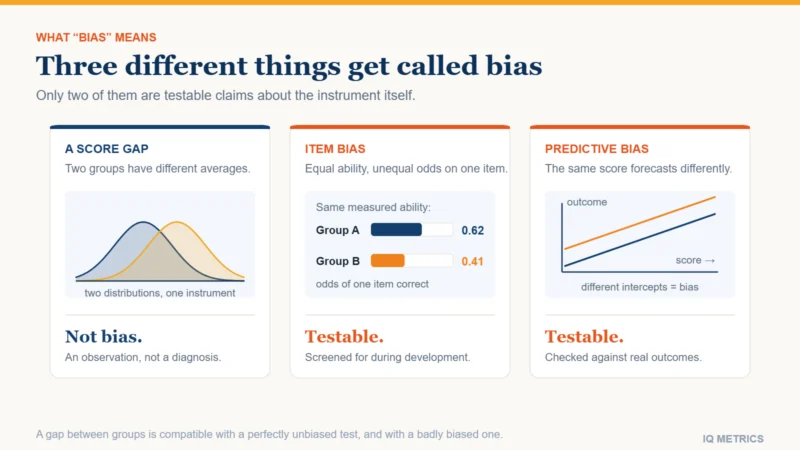
  • A test taken in a second language, or under an unfamiliar format, measures partly those things — the practical upshot of cultural bias in IQ tests.
  • Predicting a group is not forecasting a person. A 25 per cent variance share is a headwind or a tailwind, not a destination.

What follows for schools

The prediction is good enough to be useful for allocating support and poor enough to be dangerous for allocating opportunity. Those two uses look similar and are not. Using a score to decide which children get extra reading help is a low-cost decision that is easily reversed if wrong. Using the same score to decide which children enter an academic track at eleven is a high-cost decision that is difficult to reverse and that compounds over years.

The historical case against selection by test at a fixed age was built on exactly this asymmetry rather than on the tests being meaningless, and how testing has been used in education and employment traces where that argument went.

The defensible summary

Cognitive ability is a real and useful predictor of school achievement, the best single one available, and a poor basis for deciding what any individual child will do. Those statements are consistent, and holding all three at once is the whole skill.

If you want a score read the way this article argues it should be — with its scale, its percentile and its confidence range stated rather than a bare number — that is what our IQ test reports, and the version for children is normed against age-matched peers rather than adults.

Share this article

Know someone who keeps seeing these numbers quoted without the scale they were measured on? Send it to them.

Tagged Academic Achievement, Conscientiousness, intelligence test, IQ, IQ Score, iq test results, iq testing, kids iq test, Measurement Error, mental ability, Predictive Validity, Regression to the Mean, School Performance, Socioeconomic Status