IQ Metrics
IIF Certified Assessment Start IQ Test
IIF Certified Assessment

What an IQ of 85 Means

Scores & Scales

What Does an IQ of 85 Mean? The Low Average Band

A score of 85 sits exactly one standard deviation below the population mean, at roughly the 16th percentile. It is the bottom edge of what test manuals call low average, it is well clear of any clinical threshold, and on its own it says considerably less about a person than the number appears to.

Bell curve of IQ scores with the region below 85 shaded and the separate threshold at 70 marked further to the left, showing about 16 percent at or below 85 against about 2 percent at or below 70

A score of 85 is one standard deviation below the population mean. On a test scaled to a mean of 100 and a standard deviation of 15, that places it at roughly the 16th percentile: about 16 people in every hundred score at or below it, and about 84 score above.

Test manuals call that band low average or below average, depending on the publisher. It is not a clinical category, it is not close to the threshold used for intellectual disability, and the distance between those two facts is the thing most people arrive here needing.

Where 85 sits, and how many people are there

IQ scores describe position, not quantity. A test is normed on a large representative sample; the middle of that sample is called 100 and one standard deviation is called 15 points. Everything after that is arithmetic on a normal curve.

  • About 16 percent of the reference population scores at or below 85.
  • That is roughly one person in six — four or five children in an average class of thirty.
  • The band from 80 to 89 is one of the most populated stretches of the whole scale.

The scale is symmetric, so 85 is exactly as far below the mean as 115 is above it, and about as common. The IQ percentile calculator will place any score against the same curve, and the IQ level chart shows the bands side by side.

Bell curve of IQ scores with the region below 85 shaded and the separate threshold at 70 marked further to the left, showing about 16 percent at or below 85 against about 2 percent at or below 70

85 is not the disability threshold, and the gap is large

This is the most common and most consequential confusion about a score in this range.

The diagnostic threshold associated with intellectual disability is approximately 70, two standard deviations below the mean, at about the 2nd percentile. Eighty-five is a full standard deviation clear of it. In percentile terms the difference is between roughly 16 percent of the population and roughly 2 percent — the two describe entirely different groups.

And the score alone does not carry the diagnosis in any case. Current criteria require significant limitations in adaptive functioning — conceptual, social and practical skills in daily life — alongside the cognitive finding, with onset in the developmental period. A number on its own is not sufficient, by design, precisely because a number on its own has been misused historically.

The label depends on the manual, and none of them is a verdict

There is no shared official vocabulary for score bands, and the names have changed as publishers have moved away from language that read as a judgment about people.

  • Current Wechsler editions print this range as Low Average, and the most recent revisions have moved further towards purely descriptive labels.
  • Stanford-Binet uses Low Average as well.
  • Older manuals from the early twentieth century used clinical terms that are now considered slurs, which is exactly why the vocabulary was replaced.

If a chart you have found online attaches an adjective harsher than “low average” to 85, it is not reporting a test manual. IQ classifications compares what the actual publishers print.

A full-scale 85 can hide a very uneven profile

The headline number is a composite. Underneath it sit index scores — typically verbal comprehension, perceptual or fluid reasoning, working memory and processing speed — and they do not have to agree with each other.

A full-scale 85 can be four flat indices near 85. It can equally be a verbal comprehension of 100 dragged down by a processing speed of 70. Those two profiles describe different people, suggest different support, and produce the same headline. Where the spread between indices is large, many clinicians treat the full-scale score as uninterpretable and read the indices instead.

This matters especially where a specific learning difficulty or an attention condition is in the picture, because those tend to depress particular indices rather than the whole profile. ADHD, autism, dyslexia and IQ test scores covers the characteristic patterns, and how to read an IQ test report shows where the scatter is printed.

Your own number

Where would your own score land?

Take the IIF-certified assessment and get your score with the scale it was measured on, the percentile it corresponds to and the confidence range around it — the three figures most online tests leave out.

Find your IQ score now!

Secure & encryptedInstant results10–20 minutes

The error bar, and what it does and does not overlap

A professional full-scale score carries a 95 percent confidence interval of roughly plus or minus 4 to 5 points, so a measured 85 means “the true score is very probably between 80 and 90”. Online tests are wider, sometimes much wider.

Two things follow. First, 85 and 97 really are different results: their intervals do not overlap, so the test has genuinely distinguished them. Second, 85 and 88 have not been distinguished, and neither have 82 and 85. Small differences within the band are noise. The margin of error explained has the arithmetic.

What moves a score in this range, and what does not

Scores at the lower end are more sensitive to test conditions than scores in the middle, because unfamiliarity with testing costs more when the material is already hard.

  • Conditions on the day. Anxiety, poor sleep, an unfamiliar interface and time pressure all pull results down. See test anxiety and IQ scores.
  • Language and cultural distance from the norm sample. A verbal test administered in a second language measures the language as much as the reasoning. Cultural bias in IQ tests is about what that does to items, and stereotype threat about what the situation itself does.
  • Genuine environmental exposures. Childhood lead exposure is the best-established of these, with the steepest losses at the lowest doses. See lead exposure and IQ and nutrition and IQ, which is careful about the difference between correcting a deficiency and supplementing an adequate diet.
  • Format familiarity. A second sitting reliably scores higher, mostly through the practice effect, which is about knowing the format rather than about ability.

What does not move it: brain-training apps, which improve performance on the trained task and transfer poorly to anything else. Can you improve your IQ separates the claims that survive scrutiny from the ones that do not.

When a low score is a measurement problem, not a finding

Before a score in this band is taken at face value, it is worth asking whether the test measured what it was supposed to. A depressed result can be a property of the administration rather than of the person, and there are recognisable signs.

  • The test was in a second language. Verbal subtests then measure vocabulary in that language, and the full-scale score drops accordingly. Non-verbal and culture-fair instruments exist for exactly this case; the IQ tests hub sets out which measures which.
  • An untreated sensory or attention difficulty. Uncorrected hearing or vision, or an unmanaged attention condition, depresses timed subtests first and the composite after.
  • The sitting itself went badly. Illness, exhaustion, or a rushed unsupervised online attempt produce scores that are not reproducible on a better day.
  • The test had no published norms. A number with no norm table behind it is not a percentile, whatever the results page called it.

A professional assessment reports on validity explicitly and will say when a score should not be interpreted. A short online test cannot, which is the main reason the two are not interchangeable. IQ test accuracy sets out what separates them.

What an 85 is actually useful for

Very little as a headline, quite a lot as a starting point. The legitimate uses of a score in this band are practical and specific: establishing eligibility for accommodations, identifying which index is out of line with the others, and giving a baseline that a later assessment can be compared against.

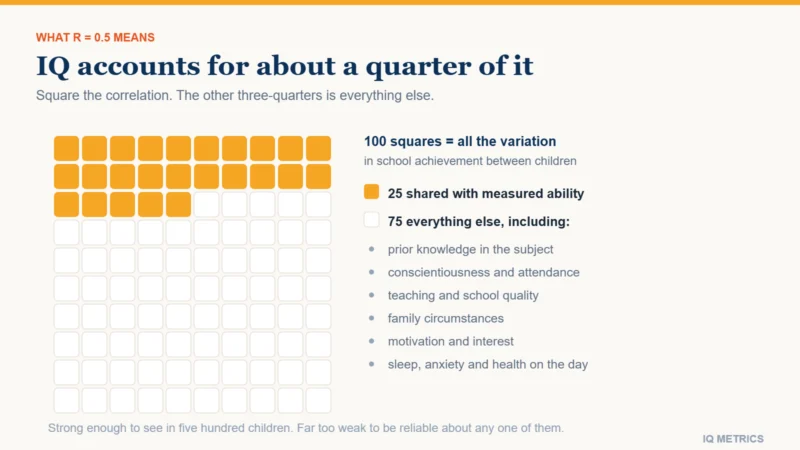
What it is not useful for is prediction about one person. Ability scores correlate with school attainment at around 0.5, which leaves about three quarters of the variation to everything else, and at the level of an individual that residual is the whole story. There is no occupation or qualification that an 85 rules out, and the range of adult outcomes within any narrow band of scores is wide and heavily overlapping.

If the number came from a short online test, treat it as a rough estimate with a wide interval and check it against what to look for before trusting an online score. If it came from a full professional assessment, the report contains far more usable information than its first page, and the indices are where to look.

Share this article

Know someone who keeps seeing these numbers quoted without the scale they were measured on? Send it to them.

Tagged below average iq, confidence interval, full scale iq, Index Scores, intelligence test, iq 85, iq scale, IQ Score, iq test ranges, low average iq, Norm Group, percentile rank, standard deviation iq, Test Accommodations

Is 130 IQ a Genius Score?

Scores & Scales

Is 130 IQ a Genius Score? What the Number Really Marks

A score of 130 is the conventional threshold for gifted identification and for high-IQ society membership, and it is reached by about one person in 44. It is not, however, a "genius" score, because no published test defines such a band. The word is a popular import, and the difference is worth understanding.

Bar chart of how rare each IQ score is, showing 1 in 2 at 100, 1 in 11 at 120, 1 in 44 at 130 and 1 in 261 at 140, with the bars shortening far faster than the scores rise

Not exactly. A score of 130 marks the conventional threshold for gifted identification and for admission to most high-IQ societies. It sits two standard deviations above the mean, at roughly the 98th percentile, reached by about one person in 44.

What it is not is a “genius” score, and the reason is simpler than it sounds: no published intelligence test has a band called genius. Not the Wechsler scales, not Stanford-Binet, not any current professional instrument. The word arrives from popular writing and attaches itself to whatever number a chart happens to have handy.

What 130 actually marks on a test manual

IQ scores are positions in a distribution. The mean of the reference sample is defined as 100, one standard deviation as 15 points, and every score is a rank against that sample. Two standard deviations above the mean is 130, and that is where the top band on most manuals begins.

The names used for that band are publisher-specific:

  • Wechsler editions have printed it as Very Superior and, more recently, Extremely High.
  • Stanford-Binet uses Gifted or Very Advanced.
  • Education systems generally use gifted, and set the line at 130 or at a local equivalent.
  • No manual anywhere uses genius.

That last point is not pedantry. “Genius” in ordinary use means exceptional creative achievement — work that changed a field. That is an outcome observed over a career, not a percentile observed in an afternoon. Conflating the two is how the internet ended up with confident IQ figures for historical figures who never sat a test, a problem taken apart in where celebrity IQ numbers come from.

How rare 130 really is

The usual claim is “the top 2 percent”, which is close enough to be repeated everywhere and wrong enough to matter. On a normal curve, the proportion at or above two standard deviations is 2.28 percent — about 1 person in 44, not 1 in 50.

The gap widens as you go further out, because rarity accelerates much faster than the score does. Ten points of IQ near the middle of the curve moves a percentile by a few points; ten points near the tail changes rarity by an order of magnitude. How rare is an IQ of 130 works the numbers through, and the IQ bell curve page shows what each stretch of the curve actually contains.

Bar chart of how rare each IQ score is, showing 1 in 2 at 100, 1 in 11 at 120, 1 in 44 at 130 and 1 in 261 at 140, with the bars shortening far faster than the scores rise

130 on one scale is not 130 on another

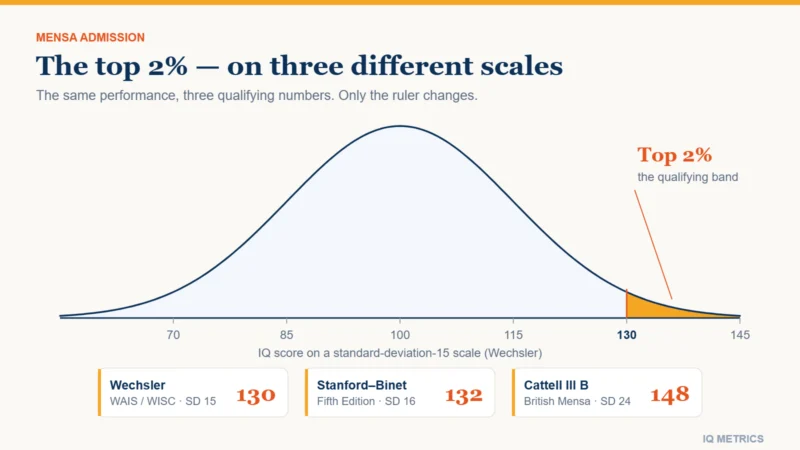
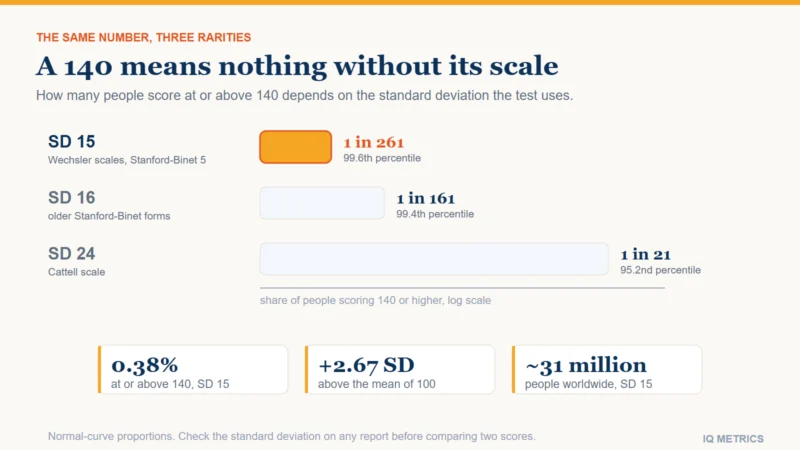
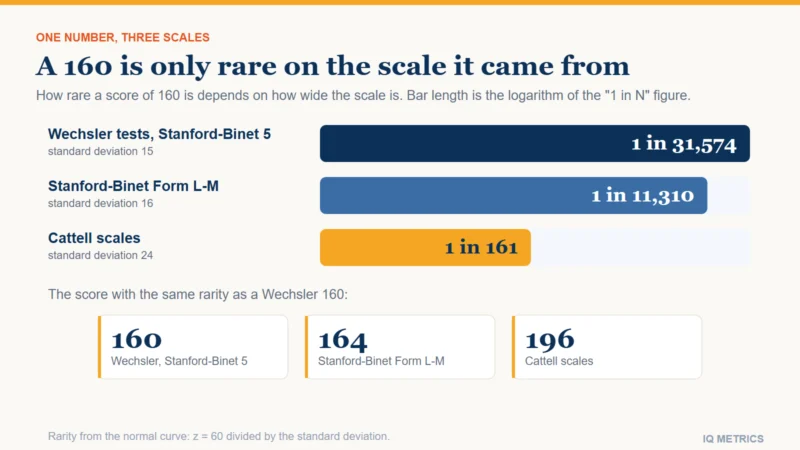
The 15-point standard deviation is a convention. Cattell’s scale uses 16, which is why Mensa publishes two qualifying numbers rather than one: 130 on a 15-point scale, 132 on a 16-point one. Both describe the same 98th percentile.

So a reported 130 means nothing until the scale is known, and a report that omits it cannot be compared with anything. Mensa IQ score requirements covers the accepted tests and the two thresholds, and the IQ score converter translates between scales directly.

The error bar straddles the line

A threshold implies a sharp edge. Measurement does not provide one.

A professional full-scale score carries a 95 percent confidence interval of roughly plus or minus 4 to 5 points. A measured 130 therefore means “the true score is very probably between 125 and 135”, and a measured 127 means “very probably between 122 and 132” — two intervals that overlap heavily. The test has not separated those two people, but a cutoff at 130 does.

This is a real administrative problem rather than a philosophical one, and it is the subject of gifted cutoff scores: who a single number misses, why local norms sometimes replace national ones, and why universal screening changes who gets identified at all. The margin of error explained covers the underlying arithmetic.

Your own number

Where would your own score land?

Take the IIF-certified assessment and get your score with the scale it was measured on, the percentile it corresponds to and the confidence range around it — the three figures most online tests leave out.

Find your IQ score now!

Secure & encryptedInstant results10–20 minutes

What 130 predicts, and what it does not

The relationships that hold at 120 hold at 130, with the same honest limits. Ability scores correlate with academic attainment at around 0.5, with job performance in complex roles more weakly than the older literature claimed, and with income mostly through education.

Two findings are specific to the high end and worth knowing:

  • The returns keep going, but they flatten. Above roughly 120 the incremental prediction of everyday outcomes weakens, though longitudinal work on very high scorers does still find differences in attainment, patents and doctorates at the top of the range. The effect is real and it is not a step change.
  • Creative achievement is not the same variable. The threshold hypothesis — that above a certain level of ability, creativity depends on other things — is contested in its strong form, but the weak version is well supported: past a point, personality, opportunity and sheer output matter more than additional points. IQ and creativity goes through the evidence.

So 130 predicts that abstract problems get solved faster than average. It does not predict originality, judgment or persistence, and it is not what distinguishes people who actually change a field. Why smart people make bad decisions is about the gap between the two.

What a high-IQ society actually asks for

If the question is really “does 130 get me in”, the answer depends on the society and, more importantly, on how the score was obtained.

  • The threshold is a percentile, not a number. Mensa asks for the 98th percentile, which is why it lists different qualifying scores for different tests rather than a single figure.
  • Supervised administration is required. No society accepts an unproctored online result, because the interval around one is far too wide and the conditions are unverifiable.
  • Prior evidence is often accepted. A qualifying score from a professionally administered test, sometimes taken years earlier, is usually enough without re-testing.
  • Other societies set higher lines. Some ask for the 99.9th percentile or beyond, where the norm tables are built on very small samples and the scores become correspondingly less reliable.

The full list of accepted tests and both qualifying numbers are in Mensa IQ score requirements, with the shorter version at the Mensa requirement explained.

A child scoring 130 and an adult scoring 130

The two are not the same claim, and conflating them causes real confusion for parents.

A child’s score is a comparison against other children of the same age, and it is considerably less stable than an adult’s. Scores measured in early childhood correlate only moderately with the same child’s scores a decade later; stability improves substantially from around school age and is high by adolescence. A 130 at five years old is a much weaker prediction than a 130 at fifteen. What age is most accurate for an IQ test goes into the detail, and the IQ scale by age explains how the age norming works.

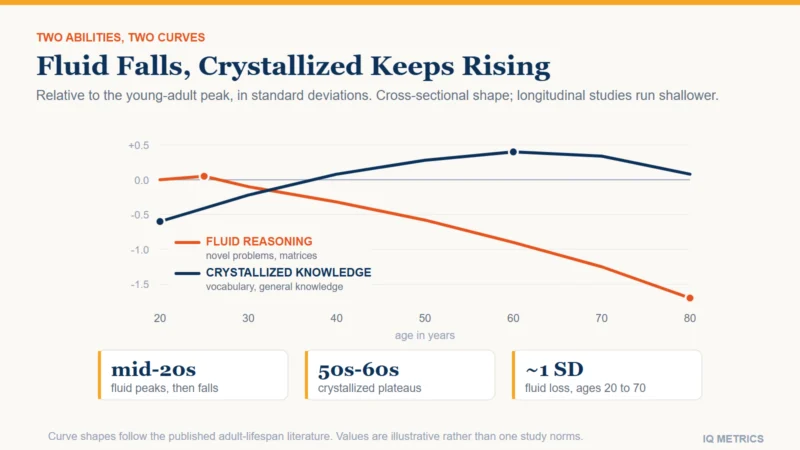
For an adult, the score is stable in the sense that the ranking tends to hold, but the underlying abilities do not all move together over a lifetime. Reasoning speed declines from early adulthood while accumulated knowledge keeps rising, and a full-scale number averages over both. IQ and age has the curves.

What the word "genius" is actually doing

Historically it was a scoring label. Lewis Terman’s early Stanford-Binet used “genius or near genius” for scores above 140, and his longitudinal study of high scorers was informally called the Genetic Studies of Genius. The label did not survive contact with the results: the cohort did well, and produced no one whose work reshaped a discipline, while two future Nobel laureates had been screened out for scoring too low.

Test publishers dropped the word for good reasons, and it survives mainly in charts written by people who are not testing anyone. If the underlying question is about the top of the range rather than the vocabulary, what is genius IQ level and what is a genius IQ score cover the ground the term usually stands in for.

If you have a 130 in hand

The full-scale number is the least informative line on the report. A 130 built from four consistent index scores describes a different profile from a 130 built out of a 145 verbal score and a 108 processing speed, and the second is common enough that clinicians have a term for it. How to read an IQ test report shows where to find the index scores and the scatter between them.

And if the score came from a short online test, the interval around it is wide enough that the threshold question is genuinely open. High-IQ societies do not accept unproctored results for exactly that reason. Where a score sits relative to the curve is easy to check with the IQ percentile calculator; whether two scores actually differ is the harder question the IQ comparison tool is built for.

Share this article

Know someone who keeps seeing these numbers quoted without the scale they were measured on? Send it to them.

Tagged confidence interval, famous high iq, genius iq, gifted cutoff, high iq society, intelligence test, iq 130, iq scale, IQ Score, iq test ranges, mensa, Norm Group, percentile rank, standard deviation iq

Is 97 IQ Dumb?

Scores & Scales

Is 97 IQ Dumb? What a Score of 97 Actually Means

A score of 97 is average. It sits three points below the population mean, which is well inside the margin of error of any test that produced it, so 97 and 100 are the same result in every way that can be measured. The interesting question is not what 97 says about you, but how little any single number can say.

Two confidence intervals drawn on an IQ scale, one for a measured 97 and one for a measured 100, overlapping across almost their whole width to show that the two scores have not been told apart

No. A score of 97 is average. It sits three points below the population mean of 100, at roughly the 42nd percentile, which puts it inside the widest band on the entire scale — the one that contains about half of everybody.

More than that: 97 and 100 are not really different numbers. The measurement error on a full-scale IQ score is larger than the gap between them, so no test has actually distinguished the two. That is the part worth understanding, and it is what the rest of this article is about.

Where 97 actually sits

An IQ score is a rank, not a quantity. The test is given to a large representative sample, the middle of that sample is defined as 100, and one standard deviation is defined as 15 points. Every score is then a statement about position relative to that reference group and nothing else.

Three points below the mean is 0.2 standard deviations. On a normal curve that lands at about the 42nd percentile:

  • Roughly 42 percent of people score below 97.
  • Roughly 58 percent score at or above it.
  • Around half the population falls in the 90 to 110 band that contains it.

The band from 90 to 110 is not a category of person. It is the fat middle of a curve, and its width is the reason the label attached to it is simply “Average” in every published test manual. You can place any score against the same curve with the IQ percentile calculator.

Two confidence intervals drawn on an IQ scale, one for a measured 97 and one for a measured 100, overlapping across almost their whole width to show that the two scores have not been told apart

97 and 100 are the same score

This is the single most useful fact about a number like 97, and it is almost never printed next to it.

Every cognitive test reports with error. A well-built professional instrument carries a 95 percent confidence interval of about plus or minus 4 to 5 points on the full-scale score. Short online tests are considerably wider. So a measured 97 means something closer to “the true score is very probably between 92 and 102”.

That interval contains 100. It contains 99, 101 and 102. Which means the test has not established that the person who scored 97 differs from the population average at all — and it has certainly not established that they differ from someone who scored 101 on the same day. The margin of error explained works through the arithmetic, and how to read an IQ test report shows where the interval appears on a real score sheet.

Compare that with a score in a genuinely different band. A 85 has a confidence interval running roughly 80 to 90, which does not overlap 100 at all. That is a real distinction. A three-point gap is not.

Take the test again and the number will move

If the same person sits a comparable test a few weeks later, the score will change, and it will change for three reasons that have nothing to do with intelligence.

  • Measurement error. The same true ability produces a spread of observed scores. Movement of several points between sittings is expected, not a sign that something went wrong.
  • The practice effect. Second exposure to a cognitive test reliably raises the score, typically by several points on non-verbal material, and the gain is about familiarity with the format rather than ability. See the practice effect.
  • Regression to the mean. An unusually low or high result tends to be followed by one closer to the middle, purely as a statistical consequence of the first result being partly luck. Regression to the mean has the detail.

None of this makes tests useless. It makes a single number a poor summary of a person, which is a different complaint. Anything that affected the sitting itself — sleep, illness, anxiety, an unfamiliar format — also shows up in the score, and the factors that affect an IQ test result lists what is known to move it.

Your own number

Where would your own score land?

Take the IIF-certified assessment and get your score with the scale it was measured on, the percentile it corresponds to and the confidence range around it — the three figures most online tests leave out.

Find your IQ score now!

Secure & encryptedInstant results10–20 minutes

What "average" describes and what it leaves out

The label “average” is a statement about a reference sample. It says the score sat near the middle of the group the test was normed on, at the time it was normed. It is not a statement about a person’s ceiling, their working life, or what they are capable of learning.

Three things it specifically leaves out:

  • The profile underneath. A full-scale 97 can be four flat index scores, or it can be a verbal comprehension of 115 against a processing speed of 80. Those describe very different people and produce the same headline number. Verbal versus non-verbal scores explains why the split matters more than the total.
  • Conditions on the day. Test anxiety, poor sleep and an unfamiliar interface all pull scores down, and their effect is largest for people who are least practised at testing. See test anxiety and IQ scores.
  • Everything the test does not sample. Motivation, conscientiousness, domain knowledge, social judgment and persistence are not on the test, and they carry real weight in outcomes. Is intelligence limited to IQ takes that seriously rather than as a consolation.

97 compared to what, exactly

Every IQ score is a comparison against a specific group of people tested at a specific time, and both halves of that sentence move the number.

The reference sample is usually national and stratified to match a census, so a score reported as 97 means “97 relative to this country’s population as sampled for this edition of this test”. Norm against a different group and the number changes without anything about the person changing. That is also why national average IQ comparisons are far weaker evidence than they are usually presented as.

Norms also expire. Raw performance on cognitive tests rose through most of the twentieth century, roughly three points a decade, so publishers periodically re-norm and the whole scale shifts back to a mean of 100. A person scoring 97 against 2010 norms would score differently against 1980 ones, on identical performance. The rise has stalled or reversed in several countries recently, which is its own story: why IQ norms expire.

The practical version of all this: a score is only as meaningful as the norm table behind it, and a test that does not publish one has not really produced a score at all.

What a 97 does not tell you about a life

Ability scores predict outcomes in the aggregate and predict individuals poorly. The correlation with school attainment is around 0.5, which sounds strong and means the score accounts for roughly a quarter of the variation. Three quarters of it sits elsewhere. At the level of one person, that residual is the whole story.

Concretely: within any band of a few points, the range of adult outcomes is enormous and overlapping. There is no attainment, occupation or qualification that a 97 excludes. There are thresholds set by other people — Mensa asks for the 98th percentile, some gifted programmes for 130 — but those are membership rules, not statements about capability.

If the number still bothers you

Two honest things can be said, and a third one cannot.

The first: the score you have is one estimate with a wide interval, and if it came from a short untimed quiz with no published norms, it is not really a measurement at all. What to check before trusting an online score is the list to run it against.

The second: what can be changed is real, but it is mostly about conditions and skills rather than the underlying ability. Familiarity with item formats, adequate sleep, and reducing anxiety all move measured scores. Correcting a genuine nutritional deficiency moves them; supplementing an already adequate diet does not. Can you improve your IQ is careful about which is which.

The third, which cannot honestly be said, is that the number does not matter at all. It measures something, and that something is related to how quickly unfamiliar abstract problems get solved under time pressure. It is simply a much smaller claim than the word “dumb” implies, and three points below a convention is not a finding about anyone.

Share this article

Know someone who keeps seeing these numbers quoted without the scale they were measured on? Send it to them.

Tagged average iq test score, confidence interval, full scale iq, intelligence test, iq 97, iq rating, iq scale, IQ Score, iq test ranges, Norm Group, percentile rank, Practice Effect, Regression to the Mean, standard deviation iq

Is a 120 IQ High?

Scores & Scales

Is a 120 IQ Score High? Where the Number Actually Sits

A score of 120 sits comfortably above average, and roughly nine people in ten score below it. But "high" is a comparison, not a property, and the honest answer depends on which scale produced the number, how much error is wrapped around it, and what you were hoping the score would tell you.

Bell curve of IQ scores with everything below 120 shaded, showing that about 91 percent of people score below that mark and about 9 percent score at or above it

Yes. A score of 120 is high. On a test scaled to a mean of 100 and a standard deviation of 15, it sits one and one-third standard deviations above the average, which places it at roughly the 91st percentile — about nine people in every ten score below it.

That is the answer. The rest of this article is about the three things the number does not say, because those are what people usually want when they ask the question: how rare 120 actually is, how much of it is real, and what it is supposed to be good for. If you want the companion piece on what a 120 reports about the measurement itself, we wrote that separately as what an IQ of 120 means, and what it does not.

Where 120 sits on the curve

IQ scores are not counts of anything. They are positions in a distribution, built by giving a test to a large representative sample and then re-expressing every raw score as a rank within that sample. The scale is fixed by convention: the middle of the reference group is called 100, and one standard deviation is called 15 points.

That convention is what turns 120 into a percentile. Twenty points is 1.33 standard deviations, and on a normal curve 1.33 standard deviations above the mean cuts off the top 9.2 percent. So:

  • About 91 percent of the reference population scores below 120.
  • About 1 person in 11 scores at or above it.
  • Inside a room of 100 people drawn at random, roughly nine others would match or beat the score.

That last framing is the one worth sitting with. A 120 is genuinely above average and it is genuinely not rare. Both are true, and which one feels more accurate depends entirely on the comparison group you have in your head. You can check any score against the curve directly with the IQ percentile calculator, or see the whole distribution laid out on the IQ bell curve page.

It is also worth noticing how quickly rarity changes as you move along the curve. Going from 100 to 120 takes you past 41 percent of the population. Going the same twenty points again, from 120 to 140, takes you past only another 8 percent, because the curve is thinning out underneath you. Equal steps in score are not equal steps in rarity, and that asymmetry is why a 20-point gap sounds like a fixed quantity and behaves like anything but. The scale is symmetric in the other direction too: 120 is exactly as far above the mean as 80 is below it, and the two are about equally common.

Bell curve of IQ scores with everything below 120 shaded, showing that about 91 percent of people score below that mark and about 9 percent score at or above it

The label attached to 120 depends on which manual you read

There is no single official vocabulary for IQ bands. Every test publisher writes its own, and they disagree at exactly the point where 120 falls.

  • On the Wechsler scales, the band containing 120 is usually printed as High Average or, in older editions, Superior — the boundary has moved between revisions.
  • On Stanford-Binet, 120 sits in Superior.
  • Many popular charts online invent a band, then attach adjectives to it that no test manual has ever used.

This matters more than it sounds. A reader who finds 120 called “Superior” on one chart and “High Average” on another has not found a contradiction in the data; they have found two publishers labelling the same slice of the same curve differently. If you want the labels compared properly, that is what IQ classifications and the ranges of IQ level are for. The number is the finding; the adjective is editorial.

Change the scale and 120 moves

The 15-point standard deviation is a convention, not a law. Some tests, Cattell’s among them, use 16 points, and a handful of high-range tests use 24. The same performance therefore produces different numbers depending on which scale printed the report.

A score of 120 on a 15-point scale is about 121 on a 16-point scale, because both describe the same 91st percentile. That is a small gap in the middle of the range, but it widens fast towards the tails, which is why comparing two scores from two different tests is a real problem rather than a pedantic one. The IQ score converter does the translation, and the 15 versus 16 problem is written up in full.

The practical rule: a score without its scale is not a score. If a report does not say what standard deviation it used, the number in it cannot be compared to anything.

Your own number

Where would your own score land?

Take the IIF-certified assessment and get your score with the scale it was measured on, the percentile it corresponds to and the confidence range around it — the three figures most online tests leave out.

Find your IQ score now!

Secure & encryptedInstant results10–20 minutes

The error bar around 120 is wider than people expect

No test measures without error. A well-built professional instrument reports a 95 percent confidence interval of roughly plus or minus 4 to 5 points on the full-scale score, and shorter or online tests are wider still.

So a measured 120 usually means something closer to “this person’s true score is very probably somewhere between 115 and 125”. Every number in that band is compatible with the evidence, and treating the printed 120 as exact is the single most common misreading of an IQ report. Two people scoring 118 and 122 have not been distinguished by the test at all. The margin of error explained covers why, and how to read an IQ test report shows where the interval is printed on an actual score sheet.

What a 120 does and does not predict

Cognitive ability scores are among the better-validated predictors in psychology, which is a lower bar than it sounds. In the ranges around 120 the relationships are real, consistently replicated, and modest.

  • Academic work. Ability scores correlate with school attainment at roughly 0.5, which means they explain about a quarter of the variation in outcomes and leave three quarters to everything else. See does IQ predict school success.
  • Job performance. The correlation in complex roles is real but smaller than the older literature claimed, and it has been revised downwards as the corrections applied to it were re-examined. What a score predicts at work has the current numbers.
  • Income. Weakly, and mostly through education. Does IQ predict income goes through the evidence.
  • Almost everything else people hope for. Judgment, discipline, creative output and good decisions are only loosely related to ability scores, which is the whole subject of why smart people make bad decisions.

None of that makes 120 unimportant. It makes it a starting condition rather than a verdict.

Is 120 high enough for a specific thing?

The question behind the question is usually about a threshold someone else has set, and those are easier to answer than the general case.

  • Mensa. No. The entry requirement is the 98th percentile, which is 130 on a 15-point scale and 132 on a 16-point one — though what 130 actually marks is a separate question from what it admits you to. See Mensa IQ score requirements.
  • School gifted programmes. Usually not, on a strict cutoff, though many districts use local rather than national norms and some screen more broadly. Gifted cutoff scores explains why the line is set where it is and who it misses.
  • Postgraduate study or a demanding profession. There is no cognitive test threshold for either, and the admissions tests that do exist measure achievement and preparation as much as ability. Achievement tests versus IQ tests draws the line.

What to do with a 120

Very little, honestly, and that is not a dismissal. A single full-scale number is the least informative thing on a proper score report. The index scores underneath it — verbal comprehension, perceptual reasoning, working memory, processing speed — carry the information that is actually usable, and a flat 120 across four indices describes a different person from a 120 built out of a 135 and a 100.

If the number came from a short online test, treat it as an estimate with a wide interval rather than a measurement. If it came from a professional assessment, the interesting reading is in the profile, not the headline. Either way the useful next questions are about the shape of the score rather than its size: verbal versus non-verbal scores and processing speed are where that starts.

And if you are here because you scored 120 and wondered whether it was good, the more useful comparison is not against other people. It is against the same test taken again under better conditions, which is a genuinely different question and one the IQ comparison tool is built to answer.

Share this article

Know someone who keeps seeing these numbers quoted without the scale they were measured on? Send it to them.

Tagged confidence interval, full scale iq, high average iq, intelligence test, iq 120, iq rating, iq scale, IQ Score, iq test ranges, Norm Group, percentile rank, Predictive Validity, standard deviation iq, superior iq

Gifted Cutoff Scores

Scores & Scales

Gifted Cutoff Scores: Why a Single Number Misses Children

Most gifted programmes draw their line at an IQ of 130. The number is a statistical convention rather than a boundary in nature, and three well-documented features of how the score is produced and used mean a strict cutoff reliably excludes children who belong on the other side of it.

Diagram showing a confidence interval straddling the gifted cutoff of 130, illustrating how two children with different obtained scores can have overlapping true-score ranges

An IQ of 130 is the usual entry requirement for a gifted programme, and it is a convention, not a discovery. It marks two standard deviations above the mean on the scales most tests use, which places it at roughly the 98th percentile. Nothing changes at that point in the distribution. There is no cognitive category boundary there; there is a round number chosen because it is convenient.

That would matter less if the number the cutoff is applied to were exact. It is not, and the gap between an obtained score and the quantity it estimates is large enough to change the answer for a great many children. Three separate features of the process compound: measurement error, the choice of comparison group, and who gets tested in the first place.

Where 130 comes from

Modern tests are scored so that the population mean is 100 and the standard deviation is 15. Two standard deviations up is 130, which leaves about 2.3 per cent of the population above it. That is the entire derivation. The choice of two standard deviations mirrors the convention on the other side of the distribution, where a similar cutoff has historically been used in defining intellectual disability.

Because it is a percentile in disguise, the same label means different things on different instruments. A test standardised with a standard deviation of 16 rather than 15 puts the same percentile at a different number, and older scales computed scores in ways that do not map cleanly onto percentiles at all. Comparing a reported 132 from one instrument with a 129 from another is not a meaningful comparison — the underlying scales differ, as IQ classifications sets out.

The measurement error nobody applies

Every well-constructed test reports a standard error of measurement, and every properly written report expresses the result as an interval rather than a point. On the major individually administered scales, the ninety-five per cent interval around a full-scale score is usually about five points either side.

Work through what that does to a cutoff. A child who obtains 128 has a plausible range running from roughly 123 to 133. A child who obtains 132 has a range from roughly 127 to 137. Those ranges overlap across most of their width. The two children are not meaningfully different on the thing the test estimates, and yet a strict cutoff admits one and refuses the other.

The same arithmetic explains why retesting produces so many reversals. A child who scores 127 in March and 133 in October has not become more able; a second draw from the same distribution came out differently, which is what the interval was warning about. Reading an interval correctly is the single most useful skill for anyone handling one of these reports, and it is covered in how to read an IQ test report.

Diagram showing a confidence interval straddling the gifted cutoff of 130, illustrating how two children with different obtained scores can have overlapping true-score ranges

National norms against local norms

A standard score compares a child to a nationally representative sample. For deciding whether that child needs a different level of instruction than their classmates are getting, the relevant comparison is often the classmates.

The two diverge sharply in schools whose intake is not representative. In a high-achieving school, a large fraction of pupils may clear a national cutoff, so the cutoff stops discriminating and the programme becomes oversubscribed. In a school serving a disadvantaged catchment, almost nobody clears it, so a child who is dramatically ahead of everyone around them and plainly under-challenged is not identified — the label is reporting the catchment rather than the child.

Local norms address this by ranking within the school. They are not a softer standard; they answer a different and more relevant question, namely whether this child is being taught at the right level given the class they are actually in. The two criteria are best used together.

Your own number

Where would your own score land?

Take the IIF-certified assessment and get your score with the scale it was measured on, the percentile it corresponds to and the confidence range around it — the three figures most online tests leave out.

Find your IQ score now!

Secure & encryptedInstant results10–20 minutes

The bigger leak: who gets tested at all

Measurement error and norm choice both assume a test happened. In many systems, identification begins with a nomination from a teacher or a parent, and only nominated children are assessed. Every child never nominated is outside the process before any cutoff is applied.

Research on districts that switched from referral-based identification to universal screening — testing every child in a given year group rather than waiting for a nomination — has found substantial increases in the number of children identified from groups that were previously underrepresented, including children from low-income households and those whose first language is not the language of instruction. The children were there; the referral step was not finding them.

This is the largest of the three effects and the easiest to fix, and it is worth being precise about what it shows. It is not a claim that the test was biased against those children. It is a claim that the step before the test decided who would be measured, and that step was not neutral. The instructions given around an assessment can matter as much as the assessment, a theme that also runs through stereotype threat.

The children a cutoff is worst at finding

Two groups are missed so consistently that the pattern is a known feature of the system rather than an accident of any one district.

The first is children whose ability and difficulty coexist — a strong reasoner who is also dyslexic, has attention difficulties, or is autistic. A full-scale score is an average across indexes, and averaging a very high reasoning index with a much lower processing speed or working memory index produces a middling composite that describes neither. The composite is the number the cutoff reads, so the child is refused on the strength of a figure that no clinician would treat as meaningful. Where the index scores are far apart, the full-scale figure should be set aside and the profile read instead — ADHD, autism, dyslexia and IQ test scores covers what those profiles look like.

The second is children still acquiring the language of the test. Verbal subtests measure vocabulary and verbal reasoning in a specific language, and a child two years into learning it will score below their reasoning ability on those subtests and much closer to it on the non-verbal ones. Averaging the two produces a composite that mostly reports language exposure. The gap between the two kinds of subtest is set out in verbal and non-verbal IQ scores.

In both cases the test is doing what it was built to do. The failure is in reducing its output to one number and comparing that number to a line.

What a parent can reasonably do with this

None of this means the score is worthless. It means a single number compared against a single line is a weak decision rule built on top of a reasonable measurement.

  • Ask for the interval, not the number. A proper report gives one. If a decision rests on a point estimate a few points from the line, the interval is the relevant fact.
  • Ask what the comparison group was. National norms and local norms answer different questions, and which one was used should be stated rather than inferred.
  • Ask whether screening is universal. If identification depends on nomination, then not being nominated is not evidence about a child.
  • Treat one session as one session. Attention, sleep and rapport with the examiner all move a result, which is why the same child produces different numbers on different days.

The useful question is not whether a child crosses a line. It is whether they are being taught at a level that fits them, which a score can inform and cannot settle. For what the high end of the scale does and does not mean, see what is genius IQ level; for how age affects the interpretation of a childhood score, see what age is most accurate to take an IQ test.

Share this article

Know someone who keeps seeing these numbers quoted without the scale they were measured on? Send it to them.

Tagged confidence interval, full scale iq, genius iq level, gifted cutoff, gifted identification, iq classifications, iq scale, IQ Score, IQ Test Range, kids iq test, local norms, Measurement Error, Norm Group, percentile rank, universal screening