IQ Metrics
IIF Certified Assessment Start IQ Test
IIF Certified Assessment

Music Taste and IQ

Research & Evidence

Music Taste and IQ: Does Your Playlist Reveal Intelligence?

Music taste and IQ are linked only weakly: the best-known study found a correlation of 0.19 with verbal ability, from 118 students. See which genres showed what, what 2026 listening data adds, and why a playlist cannot reveal IQ.

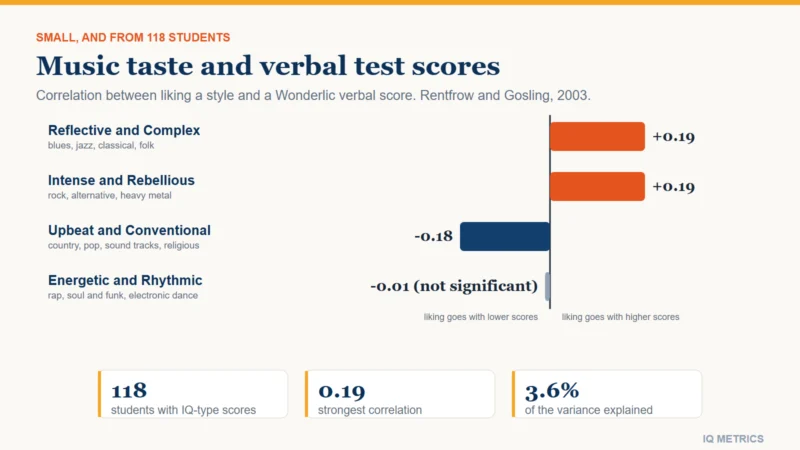
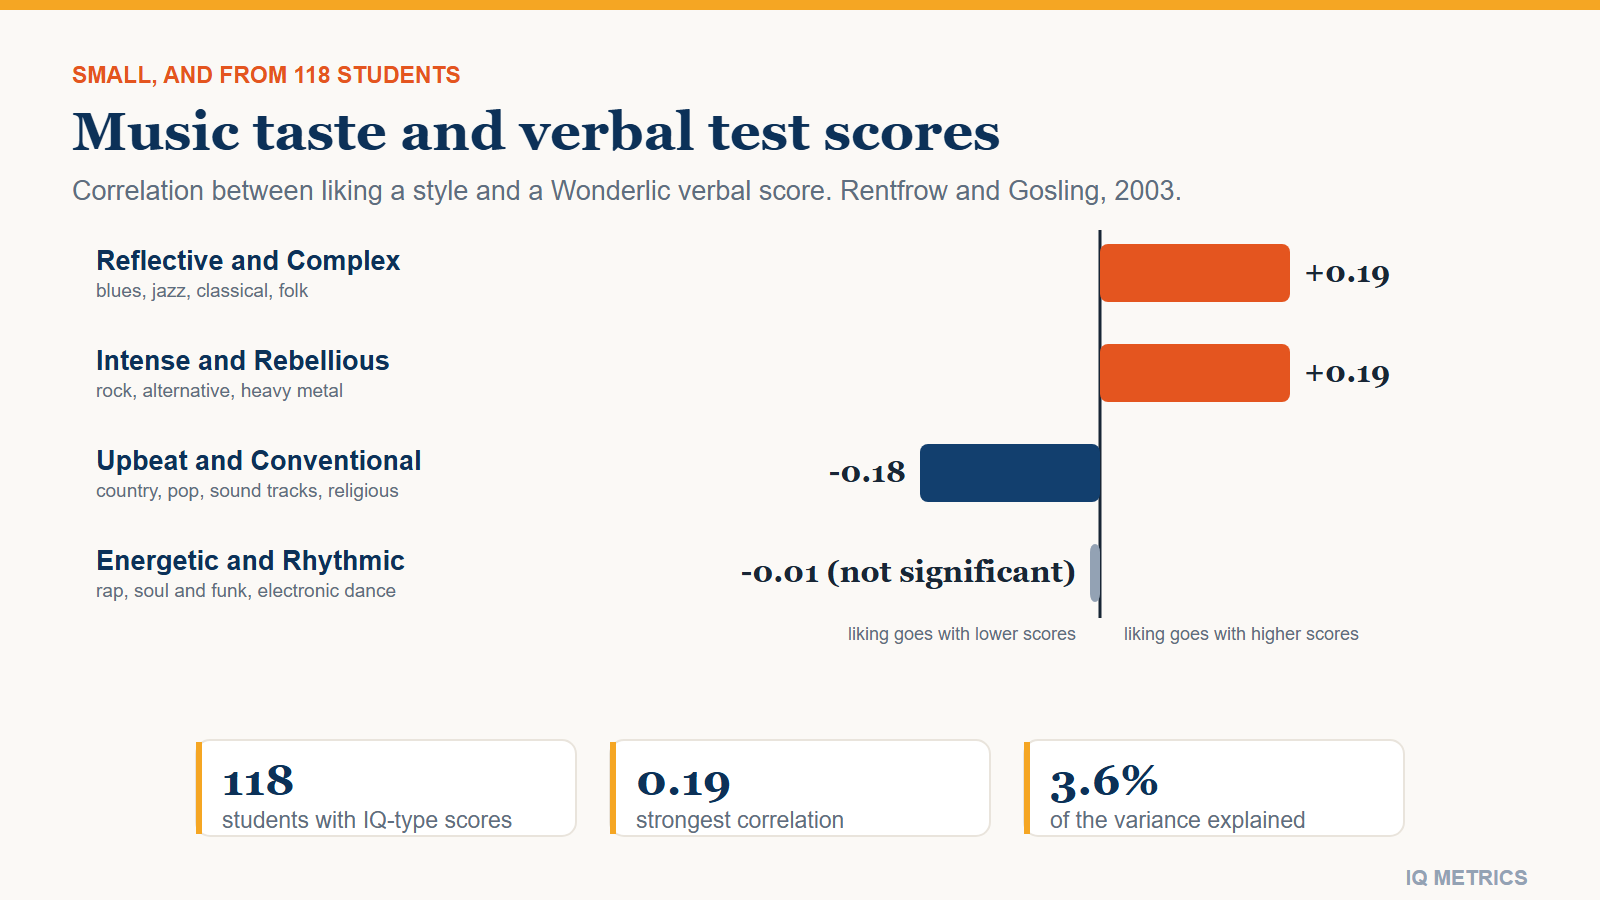
Bars showing correlations between four music-taste styles and a verbal test score: plus 0.19 for reflective and complex, plus 0.19 for intense and rebellious, minus 0.18 for upbeat and conventional and minus 0.01 (not significant) for energetic and rhythmic, from 118 students.

Music taste and IQ are linked, but only weakly. In the best-known study, Peter Rentfrow and Samuel Gosling found that liking reflective and complex music (blues, jazz, classical, folk) and intense and rebellious music (rock, alternative, heavy metal) went with somewhat higher verbal scores (r = 0.19), while liking upbeat and conventional music (country, pop, sound tracks, religious) went with slightly lower ones (r = −0.18). A correlation of 0.19 explains about 4% of the differences between people, and the IQ-type scores came from just 118 university students. A 2026 study that tracked five months of real listening in 185 people found the signal even fainter. Your playlist cannot tell anyone your IQ; this article explains what the research does show, and why.

  • The classic result: verbal score correlated +0.19 with reflective and complex and with intense and rebellious music, −0.18 with upbeat and conventional, and about zero (−0.01) with energetic and rhythmic music such as rap, soul and dance.
  • The size: r = 0.19 means about 3.6% of the variance; knowing someone’s favourite genre barely moves a guess about their score.
  • The newest data: a 2026 study of 185 people’s smartphone listening found small but reliable links to cognitive ability with one machine-learning model only, driven more by lyrics than by sound.
  • The confounds: personality, cognitive style, age, education and social identity all shape taste, and music training does not raise IQ once study quality is controlled.
Bars showing correlations between four music-taste styles and a verbal test score: plus 0.19 for reflective and complex, plus 0.19 for intense and rebellious, minus 0.18 for upbeat and conventional and minus 0.01 (not significant) for energetic and rhythmic, from 118 students.

What the best-known study found

Rentfrow and Gosling (2003) analysed the music preferences of over 3,500 people and found four underlying dimensions of taste across 14 genres. In a sixth study they tested how those dimensions related to personality, self-views and cognitive ability, giving a subsample of 118 University of Texas at Austin undergraduates the Wonderlic test — 50 items in 12 minutes — as a measure of verbal and analytic reasoning.

Music-taste dimensions and their link to verbal ability (Rentfrow and Gosling 2003)
Dimension Typical genres Correlation with verbal score
Reflective and Complex Blues, jazz, classical, folk +0.19
Intense and Rebellious Rock, alternative, heavy metal +0.19
Upbeat and Conventional Country, pop, sound tracks, religious −0.18
Energetic and Rhythmic Rap, soul and funk, electronic dance −0.01 (not significant)

Scores on analytic reasoning correlated even less — between −0.08 and +0.08, none significant — so the whole pattern is about verbal ability. The authors also report that people who like reflective and complex music rate themselves as more intelligent and score higher on Openness to New Experiences.

What a correlation of 0.19 means in practice

Squaring a correlation gives the share of variance it explains: 0.19 × 0.19 is about 0.036, or 3.6%. The other 96% of the differences in verbal score have nothing to do with which genre someone likes, so jazz fans and pop fans overlap almost completely. Put in IQ terms, each full standard deviation of extra liking for reflective music goes with about 0.19 of a standard deviation more verbal score — under 3 points on a scale where 15 points equal one standard deviation. Add the caveats: undergraduates at one university are a narrow slice of the population, a 12-minute test is a rough measure, and 118 people is a small sample that could easily produce a different number on a rerun. For how far any score from a short test can be trusted, see IQ test accuracy.

The instrumental-music theory

Satoshi Kanazawa and Kaja Perina (2012) proposed a different pattern. Their “Savanna–IQ interaction hypothesis” says more intelligent people are more likely to adopt evolutionarily novel preferences, and because music was originally vocal, purely instrumental music counts as novel. Using American General Social Survey data and the British Cohort Study, they reported that intelligence predicted a preference for instrumental music but not for vocal music, and that this was not simply because instrumental music is more cognitively complex. The hypothesis is one research team’s theory, it rests on survey answers rather than listening records, and the evolutionary argument behind it is contested. It does show how the same weak link can be read in very different ways.

Personality and thinking style do more of the work

Musical taste tracks temperament more reliably than it tracks IQ. A 2015 study in PLOS ONE led by David Greenberg tested a cognitive-style explanation across four samples (2,178, 891, 747 and 320 people) plus a replication of 353. People with an empathising style preferred mellow music (R&B, soul, adult contemporary, soft rock); people with a systemising style preferred intense music (punk, heavy metal, hard rock) and favoured tracks described as high in arousal and cerebral depth. Empathy predicted taste even within a single genre and beyond what personality traits accounted for. None of this is an IQ effect. It suggests that how a person thinks and feels shapes what they play far more than how they score, which fits the weak overlap of IQ and personality described in IQ versus personality.

What 2026 listening data adds

Most earlier studies asked people what they liked. A 2026 study in the Journal of Intelligence used smartphone music-listening records collected over five months from 185 participants. It measured listening habits, such as durations, and preferences based on audio traits (tempo, mode) and lyric traits (positive-emotion words, affiliation words), then tried to predict general cognitive ability. Out-of-sample testing showed modest performance: only the nonlinear random-forest model detected small but reliable associations, and the linear LASSO model did not. Lyrics-based preferences carried the most information, then listening habits, while audio characteristics added little. The authors describe this as initial evidence that cognitive ability may be reflected, subtly, in everyday behaviour. It is not evidence that a streaming app could read your IQ: the associations were modest, and the sample was small.

Your own number

Where would your own score land?

Take the IIF-certified assessment and get your score with the scale it was measured on, the percentile it corresponds to and the confidence range around it — the three figures most online tests leave out.

Find your IQ score now! →

Secure & encryptedInstant results10–20 minutes

Listening is not the same as playing

Taste is what you like; training is what you do, and the second has its own research history. In a widely cited 2004 experiment, Glenn Schellenberg randomly assigned 144 children to keyboard lessons, voice lessons, drama lessons or no lessons; the music groups gained slightly more IQ, an effect he called relatively small. A 2020 multilevel meta-analysis by Giovanni Sala and Fernand Gobet pooled 54 studies and 6,984 children and found that once study-design quality is controlled the average effect of music training on cognitive skills is essentially zero. Small effects (about 0.20) appeared only in studies without random allocation and with non-active control groups. So neither hearing music nor learning it has been shown to raise IQ, which fits the Mozart-effect reporting, talent versus practice and the debate in multiple intelligences theory over whether musical ability is a separate intelligence.

Why IQ-by-genre charts are unreliable

  • Self-report. Taste is usually self-reported, and people may answer in ways that flatter them.
  • Narrow samples. The classic study used undergraduates at one university; both taste and test scores vary with age and education.
  • Confounding. Education, income, personality and the social scene around a genre can all move taste and scores together.
  • Tiny effects. The largest correlation in the classic study is 0.19; fans of different genres overlap almost entirely.
  • Unsourced charts. Social-media charts that give each genre an “average IQ” rarely say where the numbers came from; peer-reviewed work reports correlations, not genre IQs.

What to take from the research

If you enjoy complex, reflective music, the research does not say you are smarter; if you love pop or rap, it does not say you are not. What it does support is modest: taste correlates weakly with verbal ability and more strongly with personality, empathy and how you like to think. Openness to Experience is the trait that links taste, creativity and, weakly, intelligence; see IQ and creativity. To find out where a score really sits, take a standardised test and read the percentile, for instance on our IQ test or with the IQ percentile calculator. For profiles of famous musicians and what is documented about their intelligence, see celebrity IQ: musicians.

Quick answers

  • Do smart people listen to classical music? On average slightly more than others: liking classical and other reflective, complex music correlates about +0.19 with verbal ability in one study, a small effect with wide overlap between fans and non-fans.
  • Does listening to rap or pop lower IQ? No. Energetic and rhythmic music (rap, soul, dance) showed essentially no link (−0.01), and upbeat and conventional music, which includes pop, showed a small negative correlation (−0.18) that reflects who chooses it, not what it does to the brain.
  • Can a music app guess my IQ? Not usefully. A 2026 study of 185 people found only small, model-dependent associations.
  • Does playing an instrument raise IQ? A 2020 meta-analysis of 54 studies found essentially no effect once study quality is controlled.

The bottom line

Music taste and IQ overlap a little and explain each other very little. The classic correlation of 0.19 comes from 118 students, the newest listening data show only a faint, model-dependent signal, and personality and cognitive style explain more of what people choose to play. Enjoy what you enjoy; it is not a test result.

Sources

Share this article

Know someone who keeps seeing these numbers quoted without the scale they were measured on? Send it to them.

Tagged classical music and iq, cognitive style, correlation not causation, high iq music, intelligence research, iq and music, iq by music genre, IQ Science, mind and everyday life, music and personality, music preference and intelligence, music taste and iq, music training and iq, openness to experience, verbal ability

Gorilla IQ

Research & Evidence

Gorilla IQ: What Koko and the Research Actually Show

Gorillas have no IQ. The quoted 70 to 95 comes from tests given to one gorilla, Koko, by her trainer. See her real scores, what wild gorillas have been shown to do, and why brain size alone cannot rank animals.

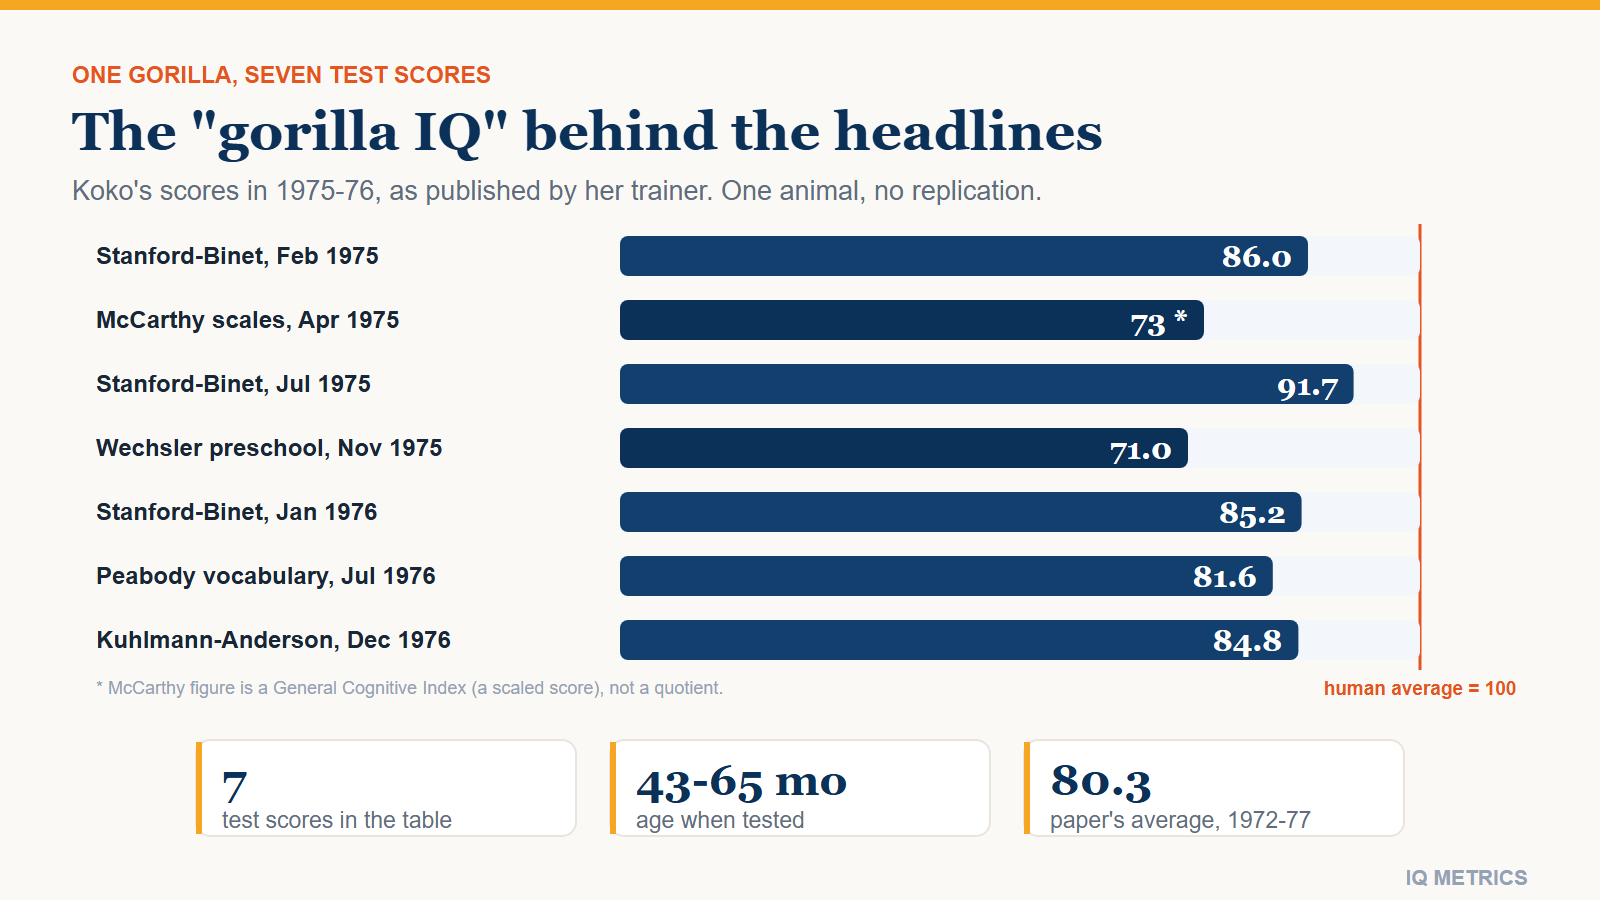
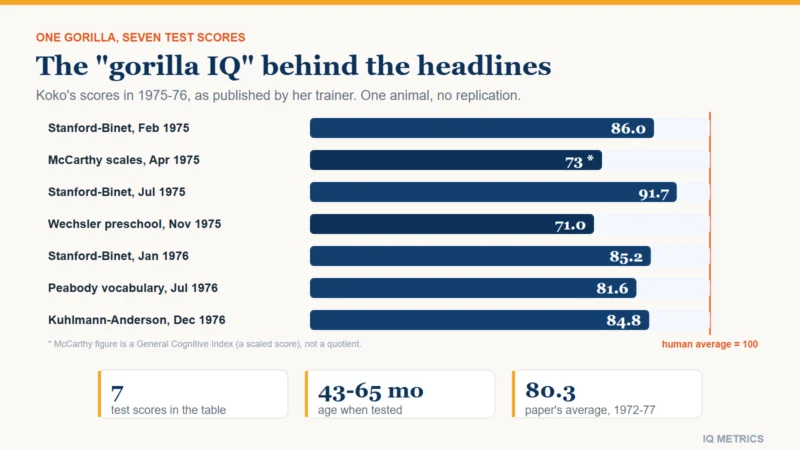
Horizontal bars of seven test scores for Koko the gorilla from 1975 and 1976, from 71.0 on the Wechsler preschool scale to 91.7 on the Stanford-Binet, all below the human average of 100.

Gorillas do not have an IQ. An IQ is a score on a human test, ranked against a sample of humans, and no gorilla has ever been given one. The figure quoted online — “a gorilla IQ of 70 to 95” — traces back to tests given to a single captive gorilla, Koko, by her own trainer in the mid-1970s. In the trainer’s published table the scores run from 71 to 91.7. What can be studied are behaviours: wild gorillas have been seen using tools, mountain gorillas process stinging nettles with a multi-step routine, and gorilla brains are about a third the size of ours. This article separates what was measured from what was claimed.

  • Koko’s numbers: seven scores in Patterson and Gordon’s table, from 71.0 (Wechsler preschool scale) to 91.7 (Stanford–Binet), and an average of 80.3 reported for tests given between 1972 and 1977.
  • Why it is not a gorilla IQ: one animal, tested by her trainer, on children’s tests normed on humans, with a mix of scoring methods.
  • What is documented: tool use in wild western gorillas (2005), sequenced food processing in mountain gorillas (1993) and a mixed record on the mirror test.
  • Brain size: gorilla and orangutan brains are about one third the size of a human brain, though the animals are at least as big as people.
Horizontal bars of seven test scores for Koko the gorilla from 1975 and 1976, from 71.0 on the Wechsler preschool scale to 91.7 on the Stanford-Binet, all below the human average of 100.

Where the gorilla IQ of 70 to 95 comes from

The number comes from Francine Patterson, who began teaching Koko (1971–2018) a modified form of American Sign Language in the early 1970s. In “The Case for the Personhood of Gorillas” (1993), Patterson and Wendy Gordon reproduce a table of Koko’s test results. Because Koko responded to instructions given in sign or in English, her team could run standard children’s tests, and the table records her age and mental age in months for each one.

Koko test scores as published by her trainer (Patterson and Gordon, Table 2)
Test Date Age when tested Mental age Reported score
Stanford–Binet Feb 1975 43 months 37 months 86.0
McCarthy Scales Apr 1975 45 months 32 months 73 (scaled index)
Stanford–Binet Jul 1975 48 months 44 months 91.7
Wechsler Preschool (WPPSI) Nov 1975 51 months 37 months 71.0
Stanford–Binet Jan 1976 54 months 46 months 85.2
Peabody Picture Vocabulary Jul 1976 60 months 49 months 81.6
Kuhlmann–Anderson Dec 1976 65 months 56 months 84.8

For the three Stanford–Binet rows and the vocabulary test, the score matches mental age divided by chronological age, times 100 — 46 ÷ 54 × 100 = 85.2. The other three do not reproduce from the ages shown (37 ÷ 51 would give 72.5, not 71.0), which suggests they were scored from each test’s own tables; the McCarthy figure is a General Cognitive Index, a scaled score rather than a quotient. The ratio method is explained in our IQ and mental age guide. The same paper says Koko “achieved scores between 85 and 95” on the Stanford–Binet and reports an average of 80.3 across tests given between 1972 and 1977. Put the 95 together with the lowest figure in the table and you get the “70 to 95” range that circulates online.

Why Koko’s score is not a gorilla IQ

  • Human norms. IQ is a ranking against people. A gorilla has no place on that curve; the score only says how Koko’s answers compare with those of human children of the same age.
  • Language-loaded tests. The team could use these tests only because Koko understood signs and spoken English, and most items assume a child’s life experience. Patterson and Gordon report that her performance did not differ significantly whether instructions came in sign only or in English only.
  • One animal, one team. Every score comes from the same gorilla and the group that raised her; the published table does not describe independent or blind scoring.
  • Mixed methods. Some figures are 1916-style mental-age ratios that modern tests dropped, others are scaled scores from different instruments, so they do not form one consistent scale.
  • Cueing. Critics of ape-language research argued that trainers can unintentionally prompt signs — the “Clever Hans” effect — which matters for any task answered through signs.

What a gorilla brain can and cannot tell us

Gorillas and orangutans are primates at least as large as humans, yet their brains are about one third the size of the human brain. That gap was long used to argue that the human brain is unusually large for a primate. Suzana Herculano-Houzel and Jon Kaas took another route in 2011: they counted cells in the cerebella of orangutans and gorillas, used primate scaling rules to predict how large the whole brain and cortex should be, and found the predictions matched the published sizes. Their reading is that the great apes are the odd ones, having evolved unusually large bodies rather than unusually small brains. The lesson for “gorilla IQ” is that raw brain size cannot rank species; see brain size and IQ for what the human correlation does and does not show.

Tool use in wild gorillas

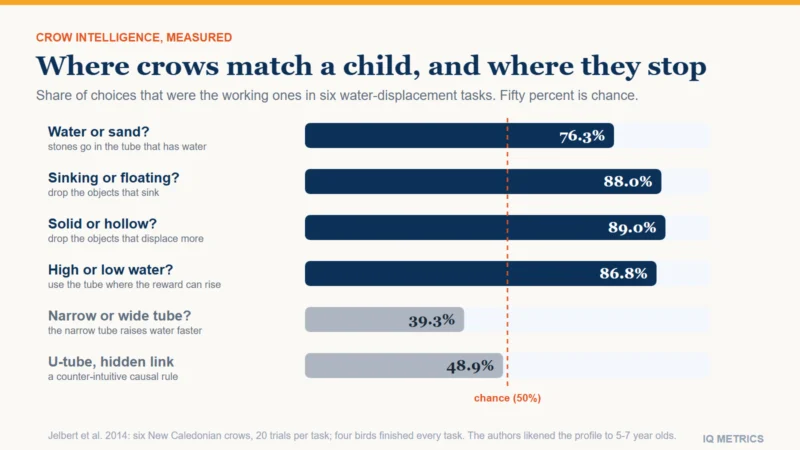
For years there was no documented tool use in wild western gorillas. Then, in 2005, Thomas Breuer and colleagues reported what they believed to be the first two observations, both at Mbeli Bai, a swampy forest clearing in northern Congo. An adult female used a branch as a walking stick to test the depth of a pool and to help her cross it. Another adult female used a detached shrub trunk as a stabiliser while processing food, then used it as a bridge over a deep patch of swamp. Other great apes mostly use tools to extract food; these gorillas used them to deal with the terrain, which suggests that habitat as well as brain power decides when tools appear. Compare the fuller record in chimpanzee IQ and the toolmakers in crow IQ.

Nettle-eating: a multi-step routine

Richard Byrne and J.M.E. Byrne studied how mountain gorillas deal with the stings, tiny hooks and spines that protect leaves such as stinging nettles. Individual gorillas differed in the small hand movements they used, consistent with trial-and-error learning of those elements. But each animal used only a few structured sequences, and the same sequences appeared across the whole population, with each stage depending on the last. The authors concluded that the logical order of the routine is probably copied from others, which they called program-level imitation. By weaning, at about 3.5 years old, young gorillas already relied on a well-established sequence. That points to planning and learning from others in a species better known for chest-beating.

Your own number

Where would your own score land?

Take the IIF-certified assessment and get your score with the scale it was measured on, the percentile it corresponds to and the confidence range around it — the three figures most online tests leave out.

Find your IQ score now! →

Secure & encryptedInstant results10–20 minutes

The mirror test: why gorillas are the odd one out

The classic test of self-recognition puts a mark on an animal’s face and sees whether it touches the mark while looking in a mirror. Chimpanzees pass; gorillas have usually struggled. One often-cited explanation is that gorillas avoid eye contact, because a direct stare is a threat, so they never study their reflection long enough to notice the mark. In 2007 Posada and Colell tested that idea on a single western gorilla, first habituating him to the observers and to the mirror as an object. He showed no aversion to eye contact, seemed relaxed with his reflection, and gave a positive response to the mark test. Patterson and Gordon describe Koko making faces and examining her teeth in front of a mirror. One gorilla is an existence proof, not a percentage, and a failed mirror test says little about an animal’s overall intelligence.

So how smart is a gorilla?

What is documented about gorilla cognition, and the catch in each case
Ability Best evidence The catch
Responds to human signs and speech Koko (Patterson and Gordon) One animal; contested by critics of ape-language studies
Uses tools in the wild Two western gorillas at Mbeli Bai (Breuer et al. 2005) Two observations, not a survey
Learns multi-step food routines Mountain gorillas and nettles (Byrne and Byrne 1993) Shows learning and sequencing, not a score
Recognises itself in a mirror One male western gorilla (Posada and Colell 2007) Most gorillas do not pass the standard test
Scores on human IQ tests Koko, 71.0 to 91.7 in the published table Human norms, one animal, mixed scoring methods

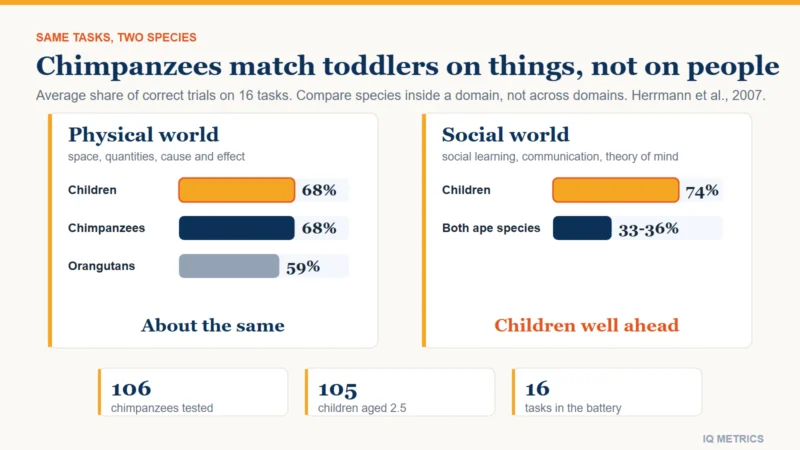
Nothing here supports ranking gorillas above or below chimpanzees or dogs by IQ. In the large test battery covered in our chimpanzee article — chimpanzees, orangutans and toddlers — gorillas were not included.

Gorilla IQ compared with other animals

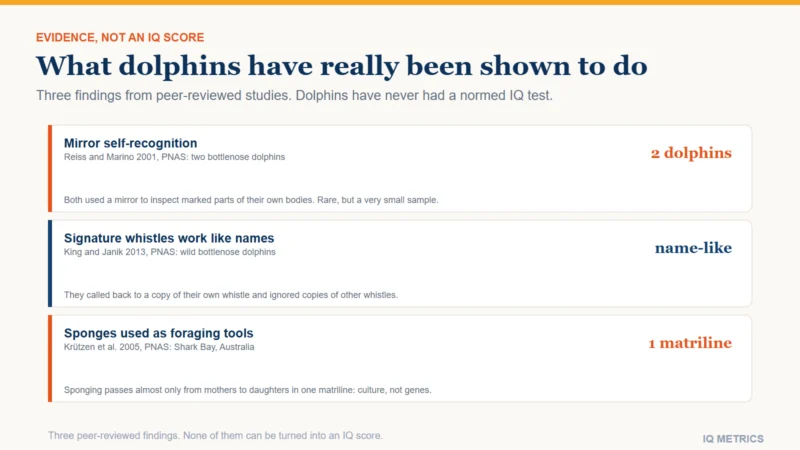
The same caveat applies to every “animal IQ” headline: a score needs a human norm group, so what is left are comparisons of behaviour. Our other animal write-ups look at what tests actually measured in dogs, crows, chimpanzees, octopuses and, in the same series, dolphins. If you want a number for yourself rather than a gorilla, the IQ test gives a score on the human scale.

Quick answers

  • What is the IQ of a gorilla? There is no valid figure. The commonly quoted 70 to 95 comes from tests given to one gorilla, Koko, by her trainer.
  • What was Koko’s IQ? Her trainer’s table lists 71.0 to 91.7 for tests in 1975 and 1976, and the paper reports an average of 80.3 for 1972 to 1977.
  • Are gorillas smarter than chimpanzees? Nobody has measured it fairly. Chimpanzees have far more test data, and gorillas were not in the large chimpanzee–orangutan–child battery.
  • Can gorillas use tools? Yes. Wild western gorillas have been seen using a stick to test water depth and a trunk as a bridge.
  • Can gorillas talk? Koko’s trainers report that she used signs and understood spoken English; critics dispute how much of this counts as language, and no gorilla produces human speech.

The bottom line

A gorilla IQ number is a headline, not a measurement. What the record supports is more interesting: an animal with a human-sized body and a brain a third as large that follows multi-step food routines, improvises with objects and, in at least one individual, recognised itself in a mirror. Koko’s scores are best read as a snapshot of one remarkable gorilla’s answers to children’s tests, not as a rank for her species.

Sources

Share this article

Know someone who keeps seeing these numbers quoted without the scale they were measured on? Send it to them.

Tagged animal intelligence, animal iq, ape language, average iq of a gorilla, brain size and intelligence, gorilla iq, gorilla tool use, great ape cognition, intelligence research, IQ Science, koko iq, koko the gorilla, mental age, mirror self-recognition, primate intelligence, ratio iq

IQ and Mental Age

Scores & Scales

IQ and Mental Age: What an IQ of 30, 50 or 70 Means in Years

Mental age is the age a typical child scores like, and ratio IQ divides it by real age. See an IQ to mental age chart from IQ 30 to 100, worked examples, and why modern tests dropped the idea for adults.

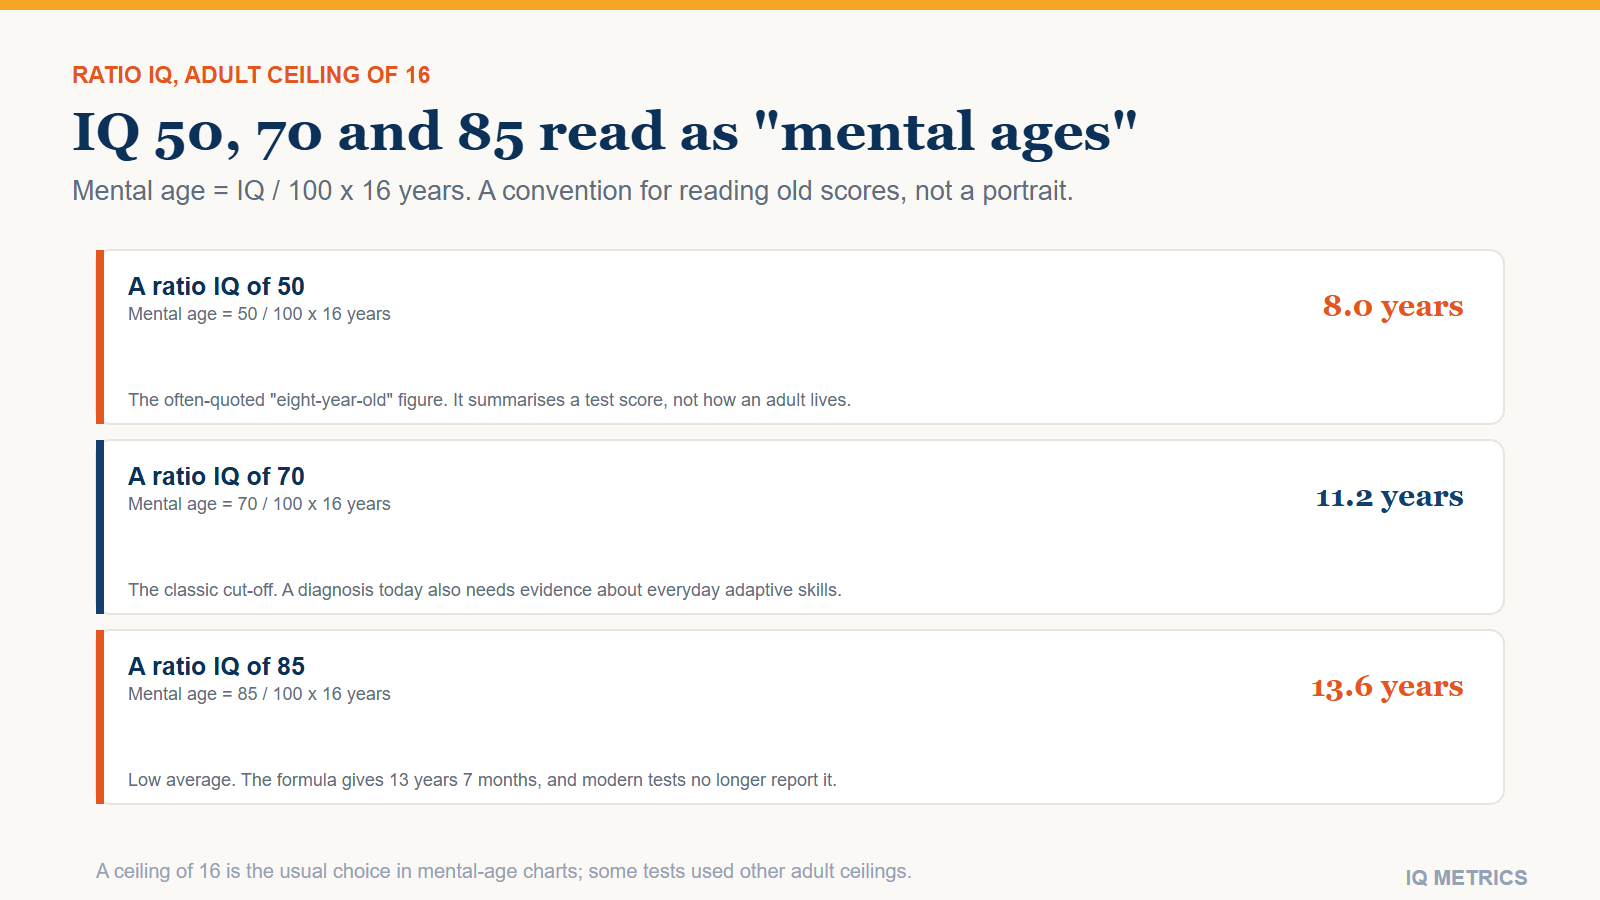
Three rows converting ratio IQ scores of 50, 70 and 85 to mental ages of 8.0, 11.2 and 13.6 years using an adult ceiling of 16 years, with a note that this is a convention and not a description of a person.

Mental age is the age at which a typical child scores the way you did on an intelligence test. Under the original ratio IQ formula, IQ equals mental age divided by chronological age, times 100 — so a 10-year-old with a mental age of 8 has an IQ of 80. Adults break the formula, because mental age stops rising in the mid-teens, so charts divide by a fixed adult age (usually 16). On that convention an IQ of 50 is a mental age of 8 and an IQ of 70 is about 11. That translation is a rough reading aid for old scores, not a description of how any adult thinks or lives, and modern tests no longer report IQ this way. This article gives the formula, a full IQ-to-mental-age chart for scores from 30 to 100, and the reasons clinicians moved on.

  • Formula: ratio IQ = (mental age ÷ chronological age) × 100, introduced by William Stern in 1912 and scaled by Lewis Terman in 1916.
  • Adult chart: with an adult divisor of 16, mental age = IQ ÷ 100 × 16 — an IQ of 30 is 4 years 10 months, 50 is 8 years and 70 is 11 years 2 months.
  • Why it faded: mental age plateaus in the mid-teens, ratio IQs varied in spread from one age to the next, and Wechsler-style deviation IQ fixed both problems.
  • Today: a diagnosis of intellectual disability weighs adaptive functioning as well as a score, which makes “mental age” a poor way to describe any adult.
Three rows converting ratio IQ scores of 50, 70 and 85 to mental ages of 8.0, 11.2 and 13.6 years using an adult ceiling of 16 years, with a note that this is a convention and not a description of a person.

What is mental age?

Mental age is an age-normed level of performance: it answers the question “which age group does this person’s test performance resemble?” The idea comes from Alfred Binet and Théophile Simon, whose 1905 scale — revised in 1908 — arranged tasks by the age at which most children could pass them. A child who solved everything a typical 8-year-old could, but nothing a typical 9-year-old could, had a mental age of 8, whatever their birth certificate said. In 1912 the German psychologist William Stern proposed dividing mental age by chronological age to get an “intelligence quotient”, and in 1916 Lewis Terman, building the Stanford–Binet, multiplied the result by 100 to remove the decimal point. That one line of arithmetic gave the world the term IQ. For the wider story see the history of IQ testing and the timeline of intelligence testing.

The ratio IQ formula, with worked examples

The formula is IQ = (mental age ÷ chronological age) × 100, with both ages in the same unit. Three children show every case:

  • A child at age level: an 8-year-old with a mental age of 8 scores 8 ÷ 8 × 100 = 100, exactly average.
  • A child behind: a 10-year-old with a mental age of 8 scores 8 ÷ 10 × 100 = 80.
  • A child ahead: a 6-year-old with a mental age of 9 scores 9 ÷ 6 × 100 = 150.

The same arithmetic shows up in the wild. In a 1993 chapter, Francine Patterson and Wendy Gordon published a table of test scores for the signing gorilla Koko, listing her age and mental age in months for each test. On the January 1976 Stanford–Binet, a chronological age of 54 months and a mental age of 46 months give 46 ÷ 54 × 100 = 85.2. What that number does and does not mean is the subject of our gorilla IQ article.

IQ to mental age chart for adults

Adults cannot be divided by their real age, or every birthday would lower their IQ. Mental-age charts therefore pick a ceiling for the adult divisor. This chart uses 16 years, the usual choice, which makes mental age = IQ ÷ 100 × 16. The questions people ask most often — “IQ of 30, what is the mental age?”, “IQ of 49”, “IQ of 68” — are answered directly in the chart.

Ratio IQ to mental age for an adult (adult divisor of 16 years)
Ratio IQ Mental age in decimal years Mental age in years and months
30 4.80 4 years 10 months
40 6.40 6 years 5 months
49 7.84 7 years 10 months
50 8.00 8 years 0 months
59 9.44 9 years 5 months
60 9.60 9 years 7 months
68 10.88 10 years 11 months
70 11.20 11 years 2 months
71 11.36 11 years 4 months
74 11.84 11 years 10 months
80 12.80 12 years 10 months
82 13.12 13 years 1 month
85 13.60 13 years 7 months
90 14.40 14 years 5 months
100 16.00 16 years 0 months

Read the chart with three cautions. Ceilings differ: a chart that divided by 15 or 18 instead would move the figures by up to a year or two. It only works for a ratio IQ: a modern deviation IQ of 70 does not translate into 11 years 2 months in the same way, because it is a rank among same-age peers, not a ratio of ages. And no chart says anything about skills, judgment or daily life — only where a score would have landed on a child’s scale.

Why mental age fell out of use

Three problems ended it. First, adults break the formula: mental age stops rising in the mid-teens while chronological age keeps climbing, so any ratio for an adult needs an arbitrary ceiling. As one reference work puts it, adult intelligence does not change from year to year, so the concept of mental age is less meaningful for adults. Second, ratio IQs were not comparable across ages. When Terman and Merrill revised the Stanford–Binet in 1937, ratio IQs had means that varied between age ranges and non-uniform standard deviations, so the manual included a formula to convert them to a mean of 100 and a standard deviation of 16. Third, an age is a poor summary of a profile: two people with the same mental age can be strong and weak in very different places.

David Wechsler’s tests, from 1939, solved the first two problems by dropping mental age altogether. A deviation IQ compares a score with the scores of people of the same age, on a fixed scale with a mean of 100. The mechanics are covered in Deviation IQ vs ratio IQ and, for the choice of spread, in the standard deviation 15 versus 16 explainer.

An IQ of 50 or 70 is not an eight- or eleven-year-old

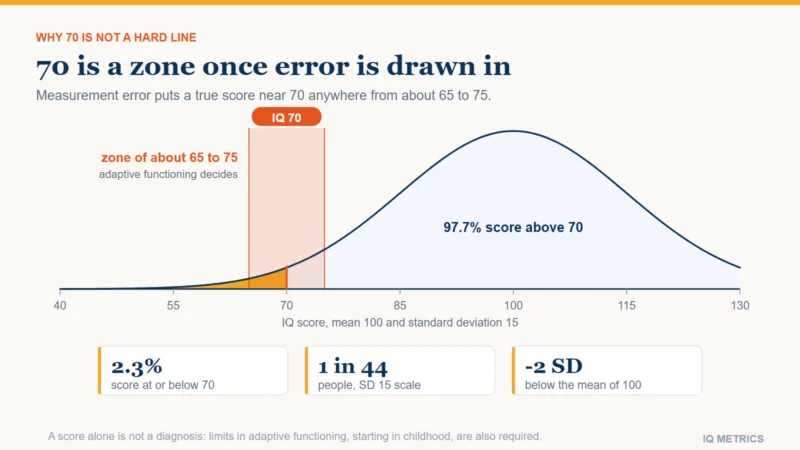
The chart’s neat numbers invite a harmful shortcut: treating an adult with a low score as a child. An adult with an IQ of 50 has decades of lived experience, adult relationships and often well-developed practical and social skills that no children’s test measures. That is why current diagnostic systems moved the emphasis. The DSM-5 specifies the severity of intellectual disability by adaptive functioning — how well someone manages conceptual, social and practical demands — rather than by IQ bands, and it requires that the difficulties began in the developmental period. A score around 70 is a screening signal, not a verdict. Our pieces on what an IQ of 70 means and low IQ versus learning disability cover the boundary in detail, and the score rules for disability benefits covers how the number is used in practice.

Your own number

Where would your own score land?

Take the IIF-certified assessment and get your score with the scale it was measured on, the percentile it corresponds to and the confidence range around it — the three figures most online tests leave out.

Find your IQ score now! →

Secure & encryptedInstant results10–20 minutes

Where mental age still shows up

The phrase survives in three places. Age-equivalent scores on some developmental and achievement tests still report that a child reads “at a nine-year-old level”, although psychometricians generally prefer standard scores and percentiles for that job. Comparisons across species borrow it too — “a dog thinks like a two-year-old” is a mental-age claim in disguise (see dog IQ and chimpanzee IQ). And everyday speech uses it as an insult, which is a good reason to avoid it. To see where a score sits on today’s scale, the IQ percentile calculator and the IQ scale by age page use the modern deviation scale, and the site’s kids IQ tests are grouped by age band and report a score rather than a mental age.

How to read a mental-age claim

  • Which test? A score from a modern Wechsler scale is a deviation IQ; only older Stanford–Binet-style scores were ratios.
  • Which ceiling? An adult mental age depends entirely on the divisor the chart chose.
  • Which person? A child’s mental age is a real comparison with same-age peers; an adult’s is a conversion.
  • What else was measured? For anything clinical, ask about adaptive functioning, not only the age figure.

Quick answers

  • What is the mental age of an IQ of 30? On the adult ratio convention (divisor 16), 4 years 10 months. Standard IQ tests seldom resolve scores this low, so clinicians use other measures.
  • What is the mental age of an IQ of 50? 8 years on the same convention.
  • What is the mental age of an IQ of 70? 11 years 2 months — the number behind the classic “11-year-old” description, which misleads more than it informs.
  • Can an adult have a mental age above their real age? On adult charts the divisor is capped, so an adult IQ above 100 gives a mental age above 16, which is a conversion artefact rather than a finding.
  • Does a modern IQ test report mental age? No. Current Wechsler and Stanford–Binet scales report standard scores and percentiles.

The bottom line

Mental age was a clever idea for measuring children in 1905 and a workable one for scoring them in 1916. Applied to adults it becomes a rough conversion, and applied to a person it becomes a stereotype. Use the chart above to decode an old score or answer a curiosity question; use a percentile, a standard score and, where it matters, an assessment of everyday functioning to understand a real person.

Sources

Share this article

Know someone who keeps seeing these numbers quoted without the scale they were measured on? Send it to them.

Tagged adaptive functioning, binet-simon scale, chronological age, deviation iq, intellectual disability, iq and mental age, iq mental age chart, iq of 50 mental age, iq of 70 mental age, IQ Science, IQ Score, mental age, ratio iq, stanford binet

IQ and BMI

Research & Evidence

IQ and BMI: What a Sibling-Comparison Study Found

Cognitive ability and adult BMI correlate, but a sibling-comparison study found the link shrinks by about 90 percent within families. See what that implies about family background versus a direct causal effect.

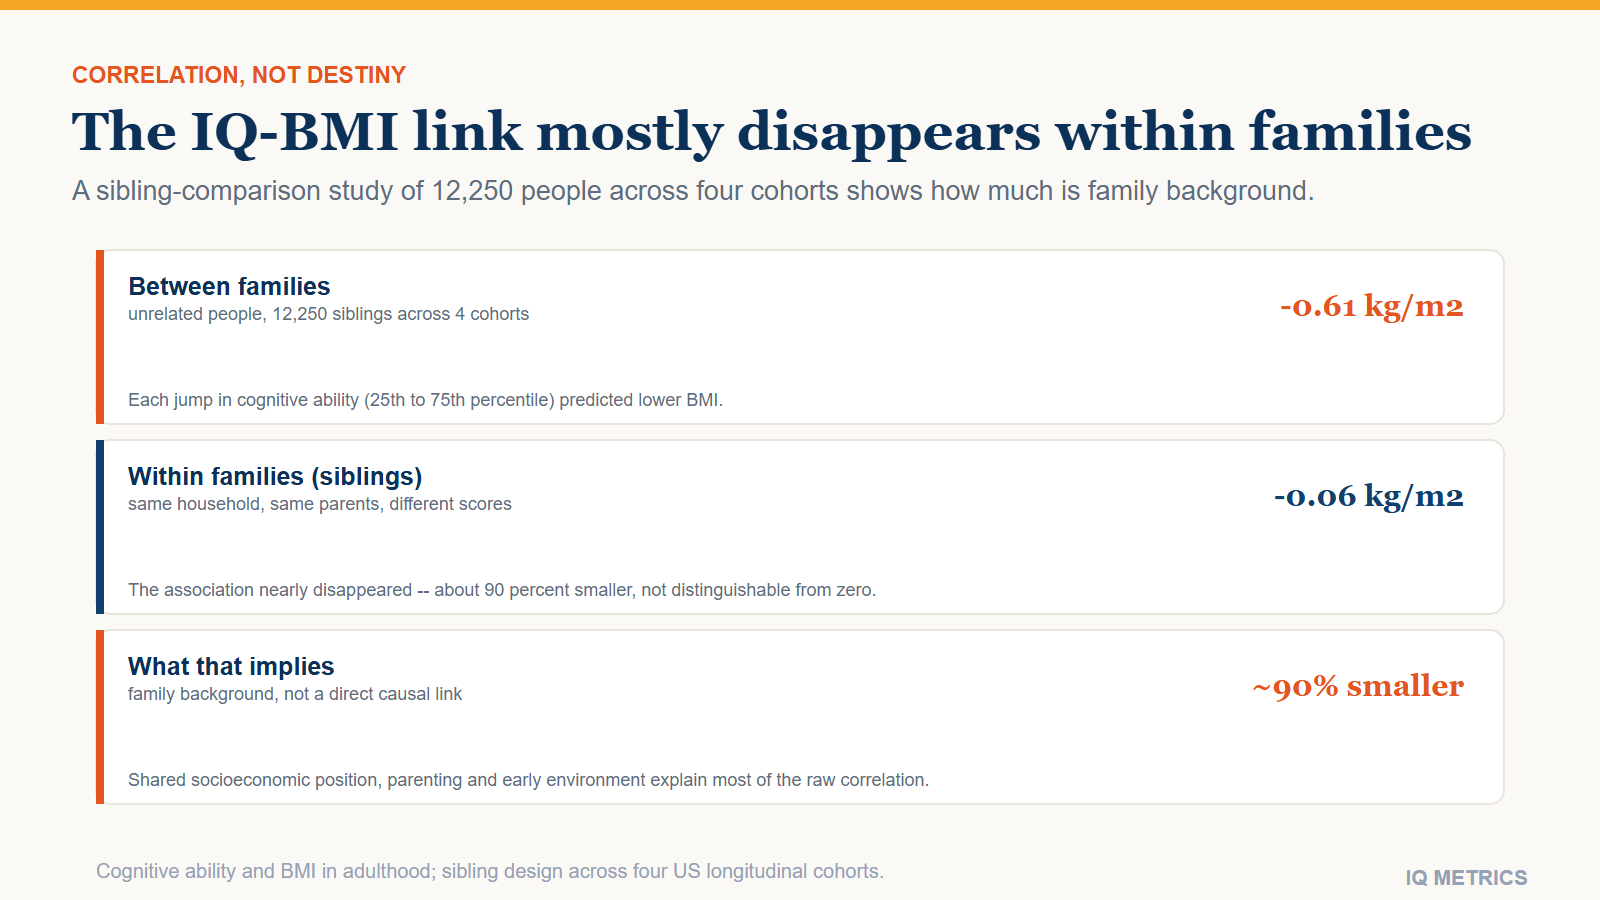
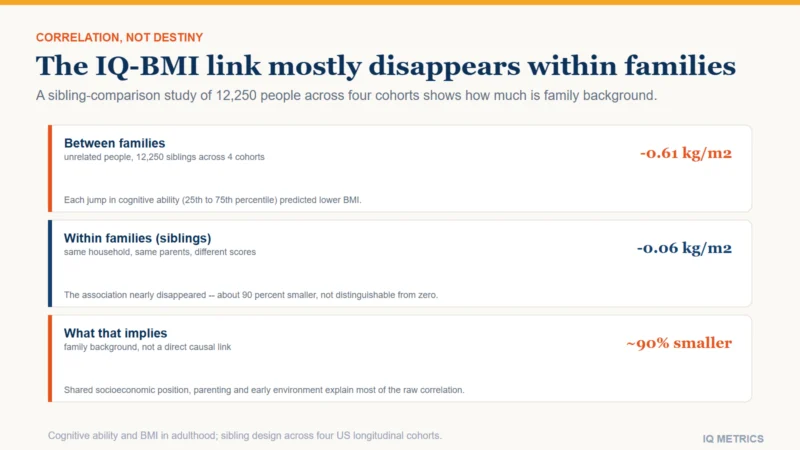
Three rows showing the cognitive ability and BMI link shrinks from a 0.95 kg/m2 difference between families to a statistically insignificant 0.06 kg/m2 within families of siblings, a roughly 90 percent reduction.

Higher childhood cognitive ability does predict a somewhat lower body mass index in adulthood, and the correlation is real and well replicated. But a 2023 sibling-comparison study spanning four long-running cohorts and more than 12,000 people found that comparing brothers and sisters raised in the same household — who share genes, parents and a childhood environment — shrinks the association by about 90%, to something no longer statistically distinguishable from zero. That is strong evidence the raw population-level correlation is mostly explained by family background, not by intelligence itself acting directly on body weight. This article covers how strong the population correlation is, what the sibling design shows, the competing explanations researchers consider, and what none of it means for any one person.

  • Population level: moving from the 25th to 75th percentile of childhood cognitive ability predicts roughly 0.6 to 1.0 kg/m2 lower adult BMI, depending on which controls are applied.
  • Within families: the same comparison among siblings shrinks to about -0.06 kg/m2, no longer distinguishable from zero.
  • What that implies: shared family background, not a direct effect of intelligence on body weight, explains most of the raw correlation.
  • Direction is debated: researchers have proposed both “ability shapes long-term health habits” and “shared early-life factors affect both the brain and metabolism” as explanations for what remains.
Three rows showing the cognitive ability and BMI link shrinks from a 0.95 kg/m2 difference between families to a statistically insignificant 0.06 kg/m2 within families of siblings, a roughly 90 percent reduction.

How strong is the population-level correlation?

A 2023 sibling-comparison study drew on four major United States longitudinal cohorts — the National Longitudinal Survey of Youth 1979, its Children and Young Adults supplement, the National Longitudinal Survey of Youth 1997, and the Wisconsin Longitudinal Study — following more than 12,000 siblings from adolescence into later adulthood. Comparing unrelated people across different families, moving from the 25th to the 75th percentile of childhood cognitive ability predicted about 0.95 kg/m2 lower adult BMI; adjusting for socioeconomic position narrowed that to about 0.61 kg/m2, still a real and statistically clear association.

What the sibling design shows
Comparison BMI difference (25th to 75th percentile of ability) Statistically distinguishable from zero
Between families, unadjusted -0.95 kg/m2 Yes
Between families, adjusted for socioeconomic position -0.61 kg/m2 Yes
Within families (siblings) -0.06 kg/m2 No

Why comparing siblings is a stronger test

Siblings share on average half their genes, the same household, the same parents and largely the same neighbourhood, schooling access and upbringing. If the population-level correlation were mostly caused by family-level factors, such as parental education, household income or shared food and activity patterns, it should shrink dramatically when the comparison moves from unrelated children across different families to siblings within the same one. That is exactly the roughly 90% shrinkage the study found. The same logic underlies how twin and family designs separate genetic and environmental explanations more broadly, and how assortative mating research uses family structure to test causal stories rather than relying on raw correlation alone.

How small is a 0.6 kg/m2 difference, really?

Kilograms per square metre is an abstract unit, so it helps to translate it. For an adult of average height, a BMI difference of 0.6 to 1.0 kg/m2 works out to roughly 2 to 3 kilograms, about 4 to 7 pounds, of body weight — noticeable on a bathroom scale, but small next to the natural spread of body weight within any group of people who score similarly on a cognitive test. A correlation this size explains only a few percent of the variation in BMI between people at most, which is why the population-level pattern coexists with enormous overlap: plenty of people with high cognitive scores carry a higher BMI than plenty of people with average or low scores, and vice versa. For comparison, a correlation researchers usually call strong, such as IQ’s relationship with school grades, sits closer to 0.5 — several times the size of anything found here.

Two competing explanations for the small remaining link

Researchers weighing what is left after the sibling correction generally point to two possibilities, neither of them proven. One is that executive function and planning ability, both part of what cognitive tests measure, help people manage diet, exercise and weight more consistently over decades, producing a small but real metabolic advantage over a lifetime. The other is that shared early biology, such as prenatal nutrition, birth weight or early-childhood health, independently shapes both brain development and a person’s later metabolic set point, producing a correlation between cognitive ability and body weight without either one causing the other. The sibling result mainly shows the effect is not large at the individual level; it does not settle which, if either, of these stories explains what remains.

Does obesity lower IQ, or does IQ predict obesity?

The research literature runs in both directions at once. Some pooled analyses of school-age children have found a substantially lower average IQ among children already classified as obese, on the order of several points in some pooled estimates. A separate line of research, sometimes called cognitive epidemiology, asks the reverse question: whether childhood IQ predicts adult body weight decades later, which is the direction the sibling-comparison study addresses directly. The honest summary is that a correlation shows up in both temporal directions, but the sibling evidence suggests neither a purely “obesity causes lower IQ” nor a purely “IQ causes lower BMI” story explains most of it — family background does a great deal of the work either way. See socioeconomic status and IQ and nutrition and IQ for related confounders that touch both traits at once.

Your own number

Where would your own score land?

Take the IIF-certified assessment and get your score with the scale it was measured on, the percentile it corresponds to and the confidence range around it — the three figures most online tests leave out.

Find your IQ score now! →

Secure & encryptedInstant results10–20 minutes

What this does not mean for any one person

Within any cognitive-ability group there is enormous variation in body weight, and within any BMI group there is enormous variation in cognitive ability. Even the largest, unadjusted population correlation here explains only a small share of the difference between people, and the within-family result suggests the true individual-level effect is close to zero. This is a population-level pattern about averages across thousands of people, not a rule for judging any one individual’s intelligence from their weight, or the reverse.

How this compares with other physical correlates of IQ

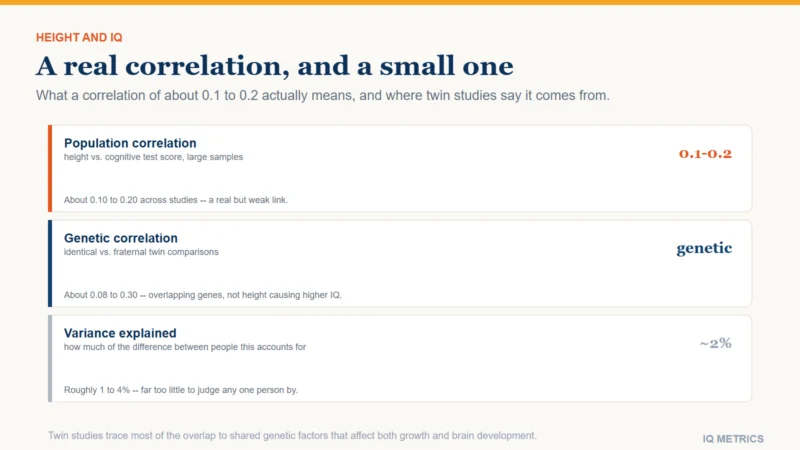
Height and IQ show a similarly shaped story, covered separately in a related piece on alcohol and cognition and in the site’s own height-and-IQ article: both are small, real, population-level correlations that shrink substantially under a stronger causal design. Where height’s correlation leans more toward a shared genetic explanation once nutrition is accounted for, BMI’s leans more heavily toward shared family environment once the sibling design is applied — a useful reminder that similarly sized correlations do not always come from similar underlying causes.

Quick answers

  • Does a high IQ mean someone will stay thin? No. The population-level link is small, and it nearly disappears when comparing siblings raised together.
  • Does obesity cause lower intelligence, or the other way around? Research finds a correlation in both directions; the sibling evidence suggests family background, not a direct causal arrow either way, explains most of it.
  • Is the IQ-BMI link genetic? Partly plausible, but the sibling design points more toward shared family environment than a strong direct genetic effect.
  • How big is the effect really? Small. Even the unadjusted population correlation explains only a modest share of the variation between people.
  • Should this change how anyone thinks about their own weight or intelligence? No. A correlation this size has no diagnostic value for a single person.

The bottom line

Cognitive ability and adult BMI correlate at the population level, but a rigorous sibling-comparison study found that correlation shrinks by about 90% when comparing siblings raised in the same household, landing on a figure no longer distinguishable from zero. Family background, not a direct effect of intelligence on body weight, explains most of the original finding, and the data says nothing useful about any one individual either way.

Sources

Share this article

Know someone who keeps seeing these numbers quoted without the scale they were measured on? Send it to them.

Tagged behavioral genetics, cognitive ability bmi, cognitive epidemiology, correlation not causation, family confounding, height and iq, intelligence and obesity, intelligence research, iq and bmi, iq and body weight, iq correlation, IQ Science, obesity and iq, sibling comparison study, socioeconomic status and IQ

IQ and Alcohol

Research & Evidence

IQ and Alcohol: What the Research Actually Shows

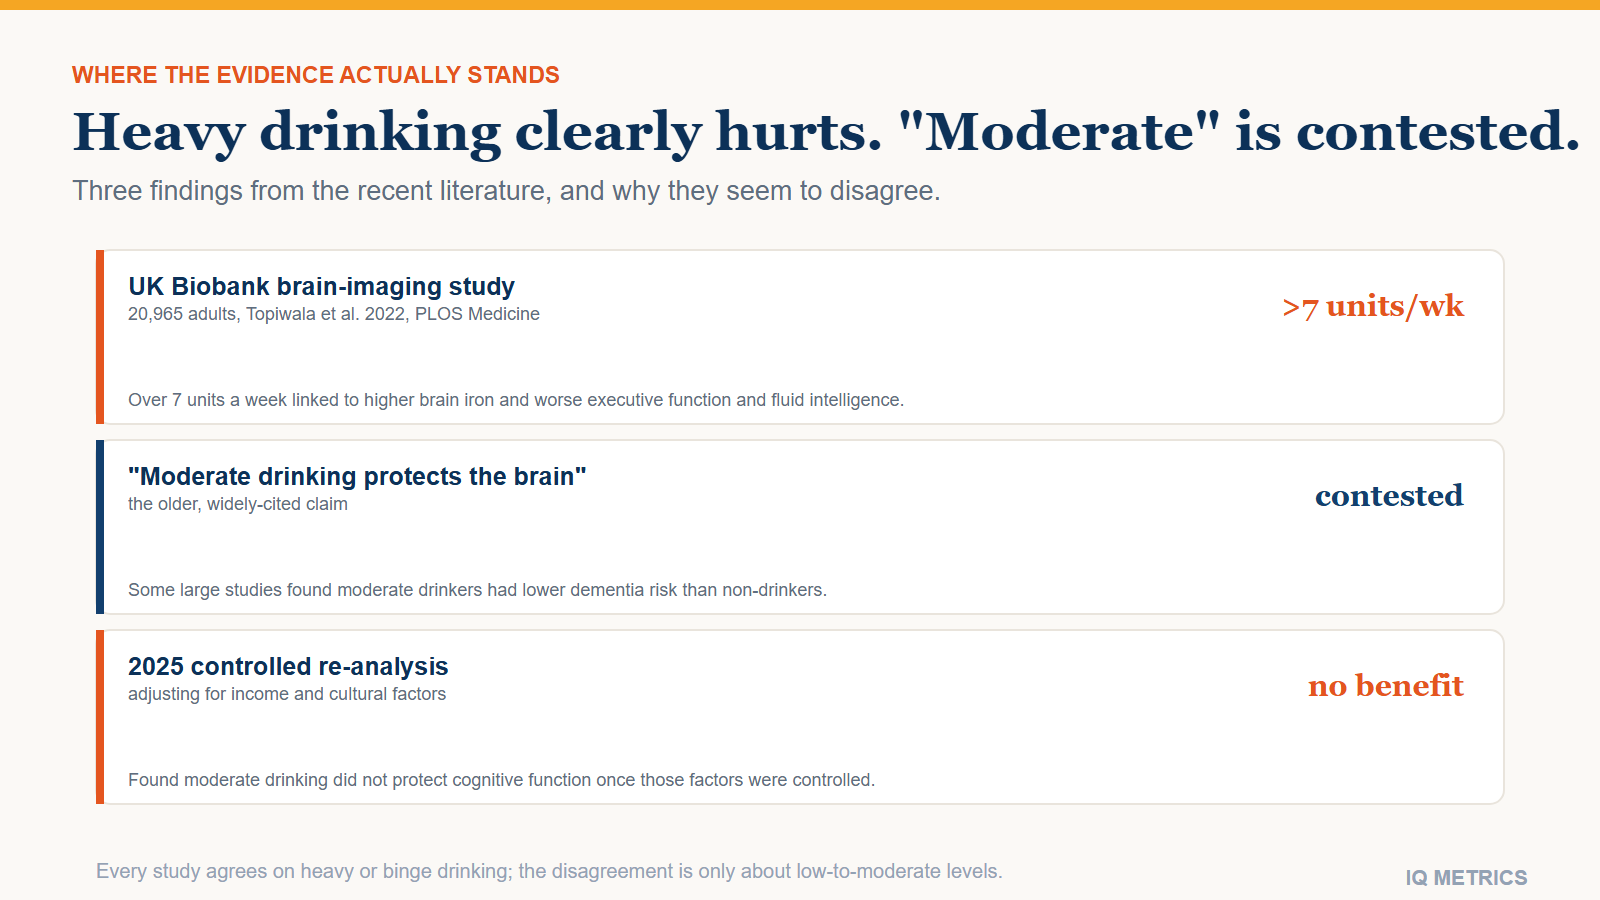
Heavy drinking clearly harms cognition; moderate drinking is genuinely contested. See what a 2022 UK Biobank study found, why older research claimed a protective effect, and why newer reviews are walking that back.

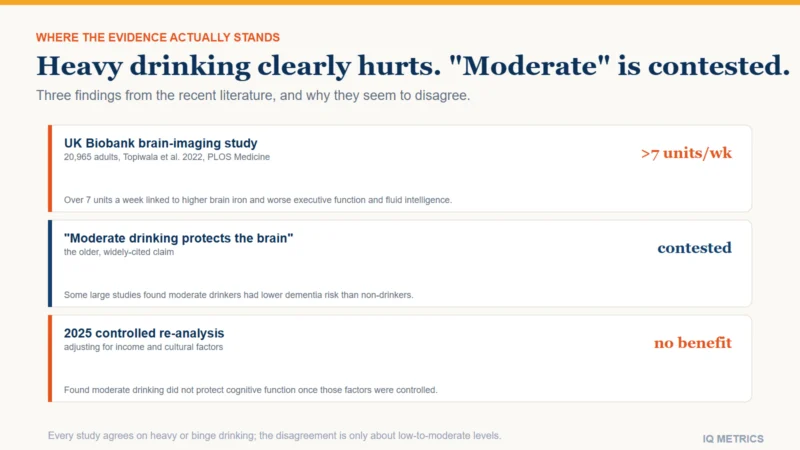
Three rows on alcohol and cognition: a 2022 UK Biobank study linking more than seven units a week to higher brain iron and worse cognitive function, the older contested claim that moderate drinking protects the brain, and a 2025 re-analysis finding no protective effect once income and cultural factors are controlled.

Heavy drinking damages the brain in ways that show up clearly on cognitive tests; that part of the picture is settled. What counts as “moderate” drinking, and whether it carries any real risk to thinking ability, is genuinely contested among researchers right now, with large, well-designed studies reaching different conclusions within the last few years. This article covers what is settled, what a major 2022 brain- imaging study found even at moderate levels, why older research suggested moderate drinking might protect against decline, and why more recent, better-controlled analyses are walking that back.

  • Settled: heavy and binge drinking cause measurable, dose-related harm to memory, processing speed and overall brain volume.
  • New finding: a 2022 UK Biobank study of 20,965 adults linked drinking more than 7 units a week to higher brain iron and worse executive function and fluid intelligence.
  • Contested: some older studies found moderate drinkers had lower dementia risk than non-drinkers; a 2025 re-analysis found that advantage disappears once income and cultural factors are controlled.
  • Why the disagreement: a well-known bias in this literature, sometimes called the “sick quitter” problem, inflates the apparent benefit of moderate drinking in many observational studies.
Three rows on alcohol and cognition: a 2022 UK Biobank study linking more than seven units a week to higher brain iron and worse cognitive function, the older contested claim that moderate drinking protects the brain, and a 2025 re-analysis finding no protective effect once income and cultural factors are controlled.

What is settled: heavy drinking and cognition

Chronic heavy alcohol use is one of the more consistently documented threats to cognitive function in the research literature. In severe, sustained cases it can produce Wernicke–Korsakoff syndrome, a serious memory disorder. Well short of that extreme, heavy use associates with dose-related shrinkage of brain volume, particularly in frontal regions tied to the same executive-function tasks an IQ test partly measures, and with measurable declines on standard cognitive batteries. This much has consistent support across decades of research and is not the part in dispute.

The 2022 UK Biobank finding on "moderate" drinking

Topiwala and colleagues (2022, PLOS Medicine) studied 20,965 UK Biobank participants who reported their own alcohol intake and had their brains scanned by MRI, with nearly 7,000 also imaged for liver iron. Drinking more than 7 units a week associated with higher markers of iron in the basal ganglia, a brain region, and higher brain iron in turn linked to worse executive function (measured with a trail-making task) and worse fluid intelligence (measured with puzzle-based tasks). The study also ran a Mendelian randomization analysis, a genetic method used to test for a plausibly causal relationship rather than pure correlation, and it supported iron accumulation as a real mechanism rather than reverse causation alone. See processing speed and IQ, memory and IQ and fluid versus crystallised intelligence for the specific abilities this kind of study measures.

Why "moderate drinking protects the brain" became conventional wisdom

Older epidemiological studies comparing drinkers against non-drinkers often found the non-drinking comparison group had worse cognitive and cardiovascular outcomes, which researchers attributed to moderate alcohol’s apparent benefits. A well-documented bias complicates that reading: many people counted as “non-drinkers” in these studies are former heavy drinkers who quit because their health was already declining, a pattern researchers call the “sick quitter” effect. That drags the comparison group’s average down and can make moderate drinkers look artificially healthy by contrast, even with no true protective effect. A large JAMA Network Open study of low-to- moderate drinking from middle to older age found the picture more mixed than the simple “moderate drinking protects” story suggests once these study-design issues are taken seriously.

What the newest reviews conclude

A 2025 study in Frontiers in Aging Neuroscience found that moderate alcohol consumption does not protect cognitive function once income and cultural factors are controlled for — the apparent benefit shrank substantially once those confounders were accounted for. Separately, a comprehensive 2025 review concluded there is currently insufficient evidence to confidently evaluate the association between moderate alcohol consumption and dementia, Alzheimer’s disease or cognitive decline, compared with never drinking at all. The honest current position is that researchers do not have a confident answer for moderate drinking either way — which is a different claim from “moderate drinking is proven safe.”

Why alcohol-and-cognition research is unusually hard to do

Nobody can ethically randomly assign people to drink a fixed amount for decades, so most of this evidence is observational, leaning on statistical corrections and genetic methods like Mendelian randomization to approximate a controlled experiment. Self-reported drinking is also known to be unreliable in both directions, “moderate” is defined inconsistently across studies (some use 7 units a week, others 14, others a daily threshold), and confounders such as diet, exercise, smoking and income all correlate with drinking patterns too. See socioeconomic status and IQ and nutrition and IQ for how the same kind of confounding complicates other correlational research on this site.

Your own number

Where would your own score land?

Take the IIF-certified assessment and get your score with the scale it was measured on, the percentile it corresponds to and the confidence range around it — the three figures most online tests leave out.

Find your IQ score now! →

Secure & encryptedInstant results10–20 minutes

What "units" actually means

A UK alcohol unit is 8 grams, or about 10 millilitres, of pure alcohol — roughly two-thirds of a standard US drink, which is defined as 14 grams. So the 7-units-a-week threshold in the UK Biobank study works out to a little under 5 standard US drinks spread across a week, well within what many people would casually call moderate. That unit mismatch matters when comparing findings across countries: a study reporting risk above 14 units a week in the UK is describing a level roughly equivalent to 10 US standard drinks, not 14, and conflating the two systems can make one study look far more permissive than it actually is.

Alcohol exposure before birth is a different question entirely

None of this should be confused with prenatal alcohol exposure, covered separately in fetal alcohol spectrum disorder and IQ. That is a well-established, much larger effect on a developing brain, with a different mechanism from adult drinking’s contested relationship with an already-developed one. Do not treat the two as the same finding at different doses.

What this means if you are weighing how much to drink

This is general information, not medical advice. Heavy and binge drinking carry clear, well-established cognitive risk, and that finding is not contested. For low-to-moderate drinking, the current evidence genuinely does not support a confident claim that it is either protective or clearly harmful at the population level, though the 2022 UK Biobank imaging data leans toward “not obviously safe” even at levels many people would call moderate. Anyone concerned about their own cognitive health, including how drinking history might interact with age-related decline, is better served by a proper clinical screen than by an online IQ test.

Quick answers

  • Does alcohol lower your IQ? Heavy and binge drinking clearly harm cognitive function over time; moderate drinking’s effect is genuinely contested.
  • How much drinking counts as “heavy”? Definitions vary by country and study, but well above 14 units a week (roughly a bottle and a half of wine) is consistently linked to harm across the literature.
  • Does a daily drink protect the brain? The evidence for this once widely repeated claim has weakened considerably in recent, better-controlled studies.
  • Is this the same as fetal alcohol spectrum disorder? No. That is prenatal exposure to a developing brain, a separate and more firmly established harm pathway.
  • Can alcohol-related cognitive decline be reversed? Partly, in some cases, especially with sustained abstinence; the research on how much recovery is possible is still developing.

The bottom line

Heavy and binge drinking clearly harm cognitive function, a finding with decades of consistent support. Moderate drinking is where the real uncertainty lives: a 2022 UK Biobank study links levels many would call moderate to higher brain iron and worse executive function, while newer, better-controlled reviews are walking back the older belief that moderate drinking protects the brain. Treat any single confident claim in either direction with some caution — the researchers studying this closely have not reached one themselves.

Sources

Share this article

Know someone who keeps seeing these numbers quoted without the scale they were measured on? Send it to them.

Tagged alcohol and cognition, alcohol and dementia risk, alcohol and memory, brain iron alcohol, cognitive decline, executive function, fetal alcohol spectrum disorder, heavy drinking cognitive decline, intelligence research, iq and alcohol, IQ Science, mind and everyday life, moderate drinking brain, Processing Speed, uk biobank alcohol study